Traffic source refers to the websites, metasearch engines, or channels from which visitors arrive at the property’s website.
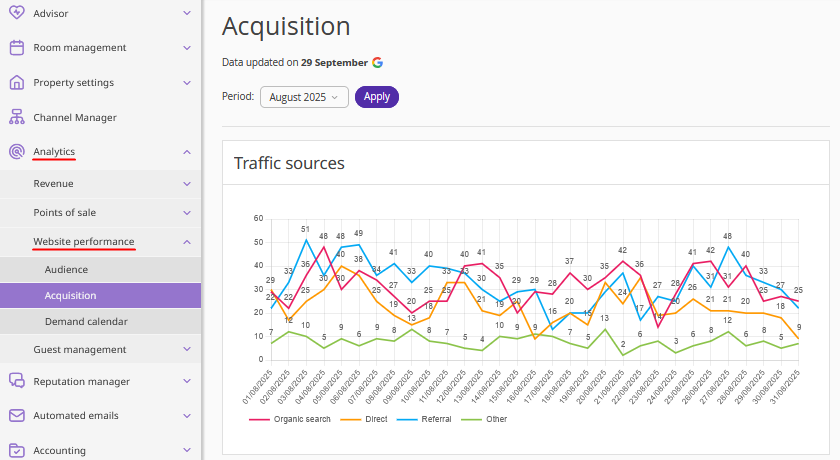
In the Exely extranet, the “Analytics” > “Website performance” > “Acquisition” section displays traffic source statistics for the selected period — including visits, traffic distribution, landing pages, and more.
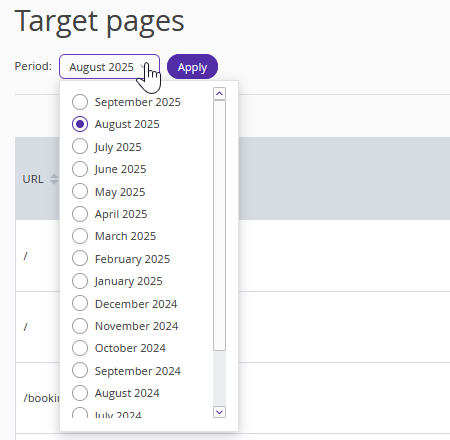
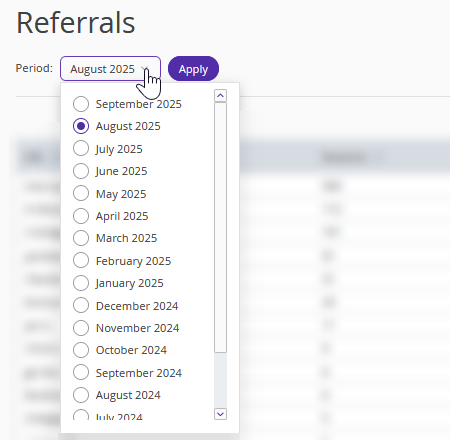
How to set the reporting period
1. On the “Acquisition” page, click the “Period” field and select the month you want to generate the report for.
2. Click the “Apply” button.
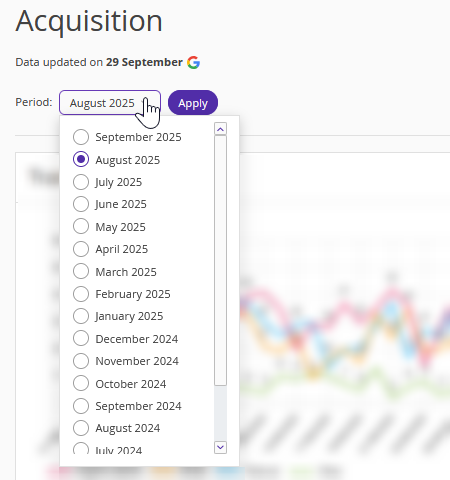
After this, the page will display statistics for the selected month.
How to read the statistics
Traffic sources
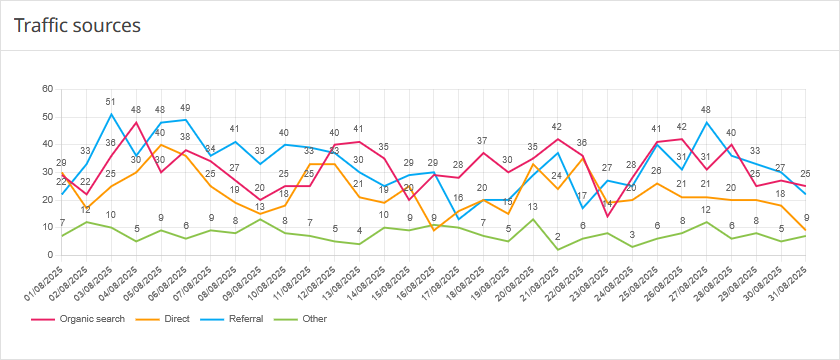
The section shows the ratio of website visits from different sources for the selected period.
On the graph:
The horizontal axis displays the dates of the selected period.
The vertical axis displays the number of visits.
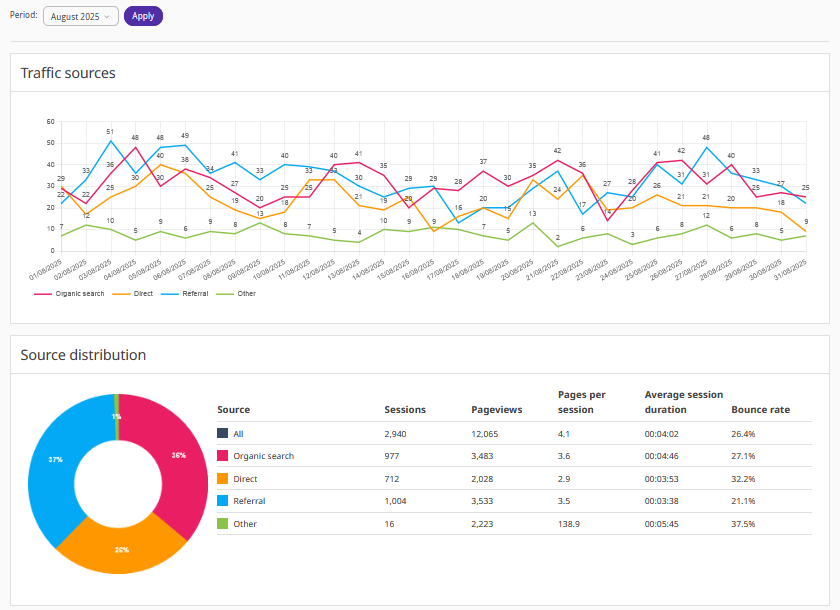
Source distribution
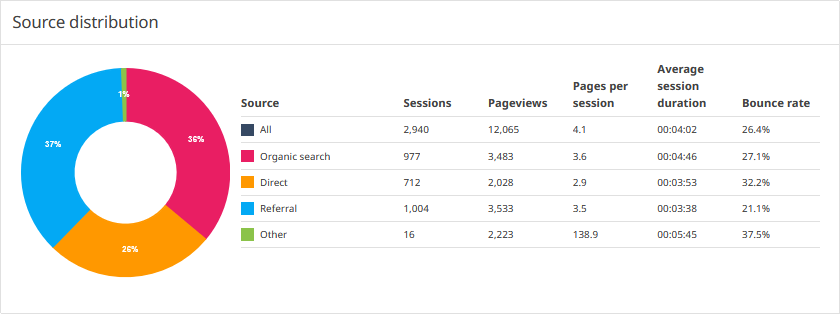
The diagram shows the sources from which users most frequently visit the website, and the data for them for the selected period:
the number of sessions;
the number of pageviews;
the number of pages per session;
average session duration;
bounce rate.
Referral
The referral graph shows the percentage of referrals from third-party websites for the selected period.
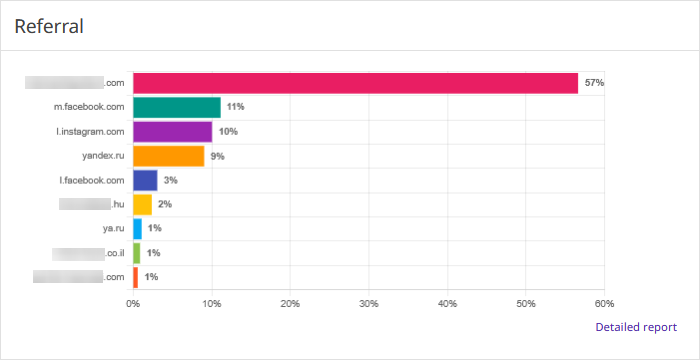
Click “Detailed report” to view the full report — it will be opened in a new tab.
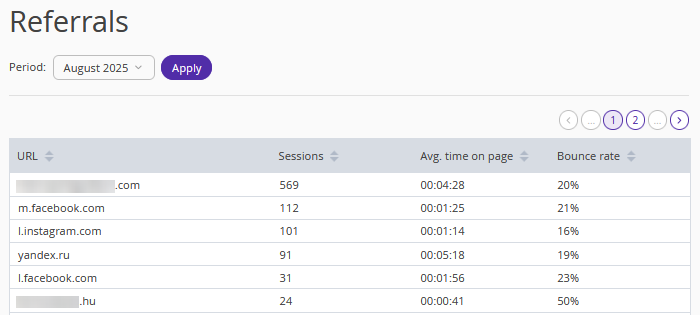
The table displays the required data on visits:
URL;
the number of sessions;
average time on page;
bounce rate.
You can select a period in the detailed report to view the relevant data.
Organic search
The graph shows the percentage of visits from search engines for the selected period.
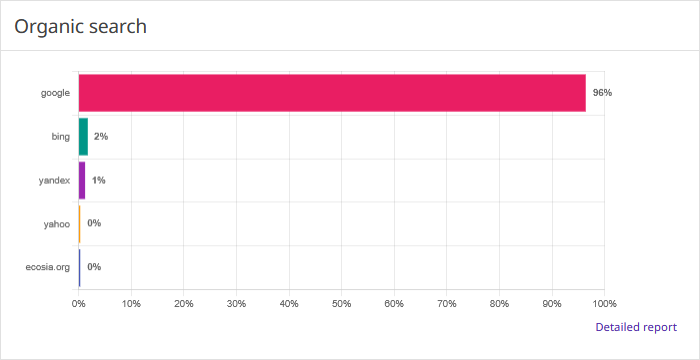
Click “Detailed report” to view the full report — it will be opened in a new tab.
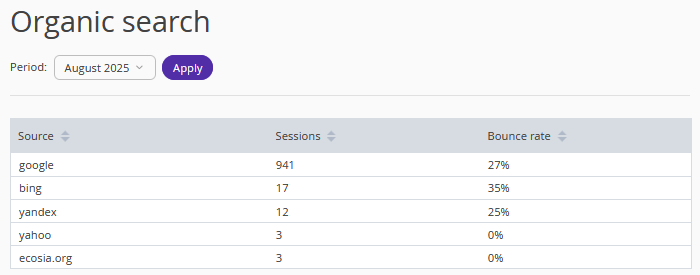
The detailed report table includes:
name of the source;
the number of sessions;
bounce rate.
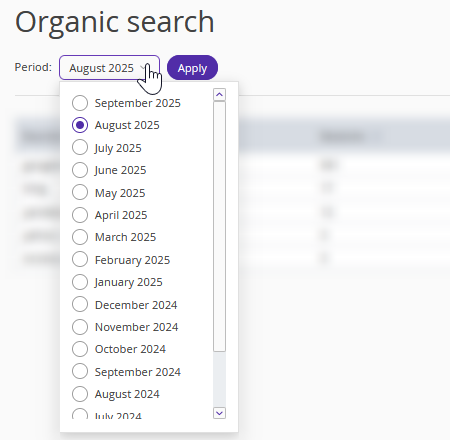
You can select a period in the detailed report to view the relevant data.
Direct
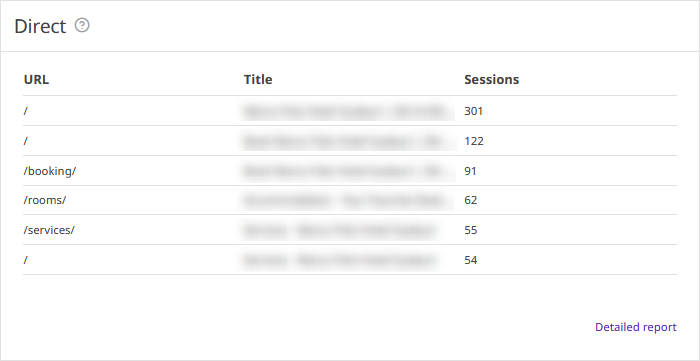
The table contains a list of website landing pages with the highest number of views for the selected period:
URL;
the page title;
the number of sessions.
Click “Detailed report” to view the full report — it will be opened in a new tab.
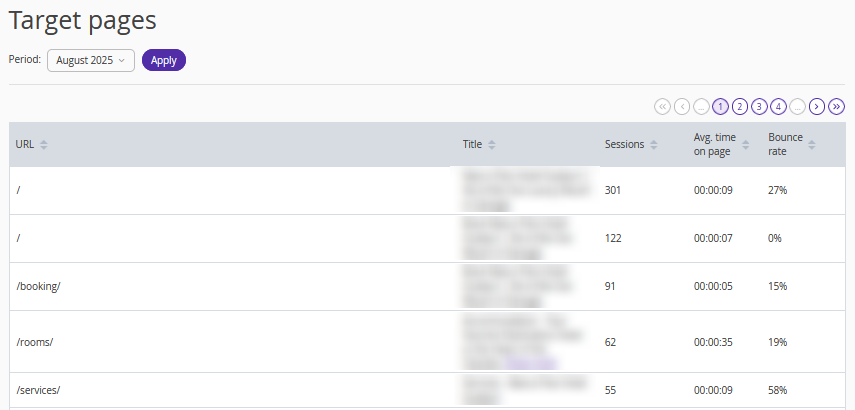
The detailed report table includes:
URL;
the page title;
the total number of sessions;
average time on page;
bounce rate.
You can select a period in the detailed report to view the relevant data.