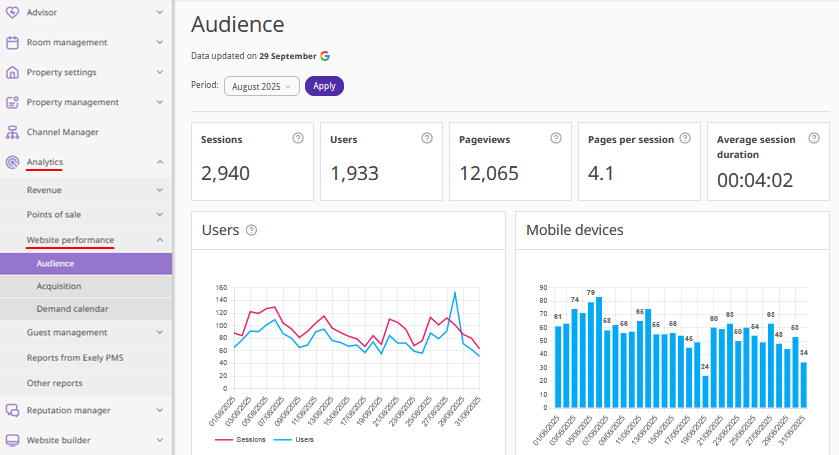
In the “Analytics” > “Website performance” > “Audience” section, you can view statistics on website visits: user activity, location, session duration, and other data for the selected period.
A session is the time during which a visitor stays on the website. It starts when a visitor opens a page and ends after they leave the website. By default, the session ends after 30 minutes of inactivity.
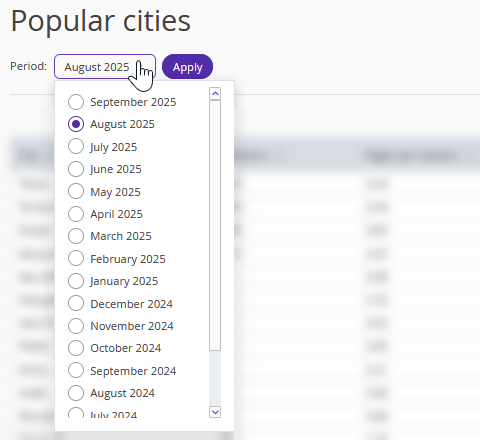
How to set the reporting period
1. On the “Audience” page, click the “Period” field and select the month you want to generate the report for.
2. Click the “Apply” button.
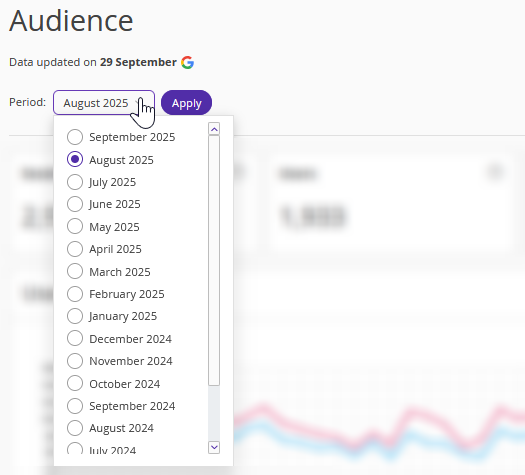
After this, the page will display statistics for the selected month.
Pay attention. Numerical data in the statistics section is automatically updated and recalculated once a day.
How to read the statistics
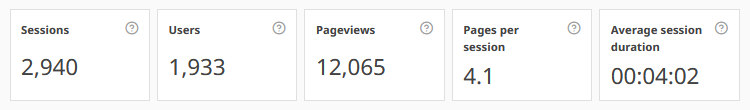
Numerical indicators in the statistics section
Sessions — the total number of sessions started on the website during the selected period.
Users — the number of unique users who performed at least one action on the website during the selected period.
Pageviews — the total number of page views during the selected period, including repeat views by the same users.
Pages per session — the average number of pages viewed per session.
Average Session Duration — the average amount of time users spent on the website during the selected period.
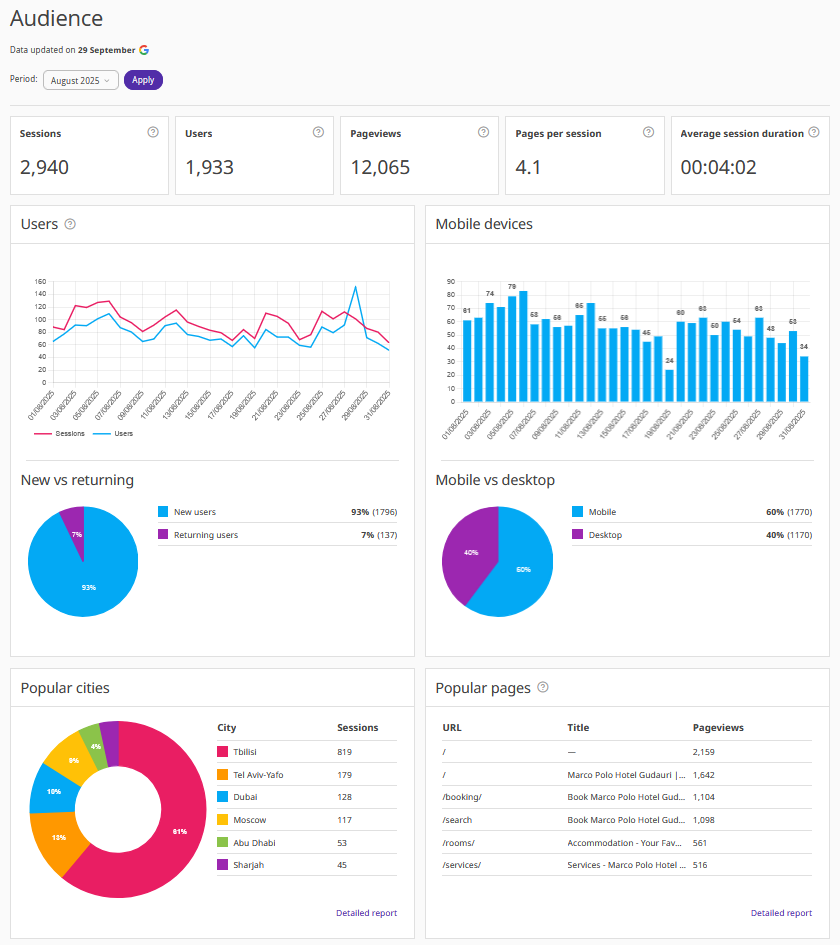
Users
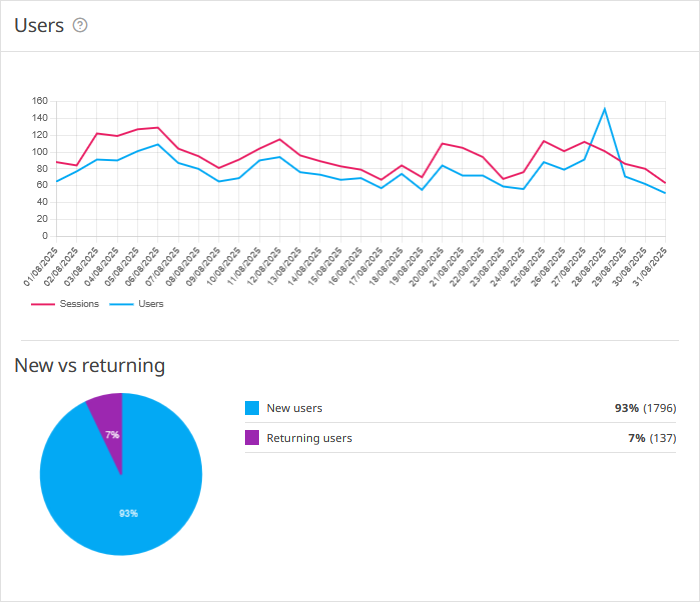
The “Users” section shows the number of visitors who accessed the website from different sources during the selected period. This section includes a “Users” graph and a “New vs returning” diagram.
The “Users” graph shows the ratio of unique visitors to the total visits for the selected period:
The horizontal axis represents the dates within the selected period.
The vertical axis represents the number of visits.
The “New vs returning” diagram shows the ratio of new to returning visitors during the selected period.
Mobile devices
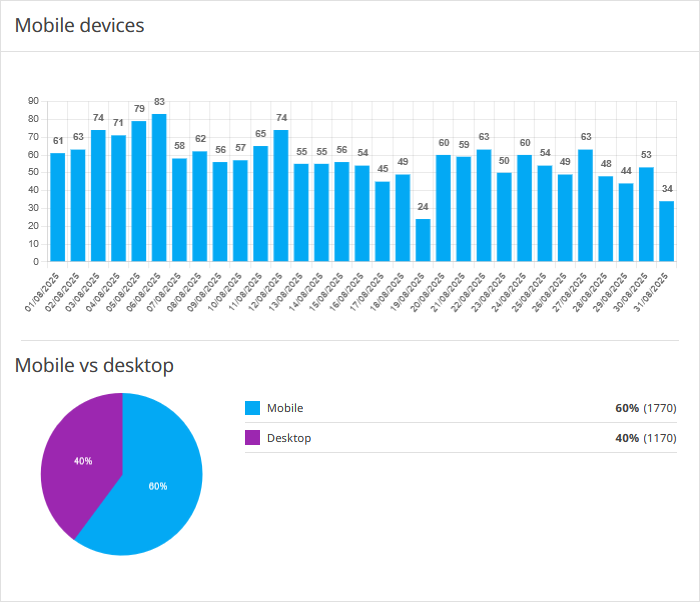
The “Mobile devices” section shows how many users accessed the website from mobile devices during the selected period. It includes a “Mobile devices” graph and a “Mobile vs desktop” diagram.
On the “Mobile devices”:
The horizontal axis shows the dates of the selected period.
The vertical axis shows the number of visits.
The “Mobile vs desktop” diagram displays the ratio of visits from mobile devices compared to visits from other devices during the selected period.
Popular cities
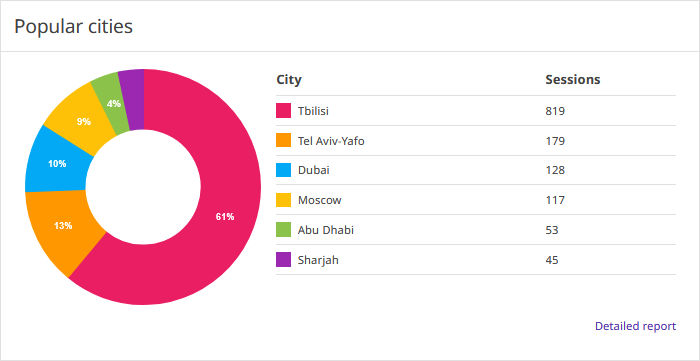
The “Popular cities” chart shows the cities from which users most frequently visit the website and the number of sessions for the selected period.
Click “Detailed report” to view the full report — it will be opened in a new tab.
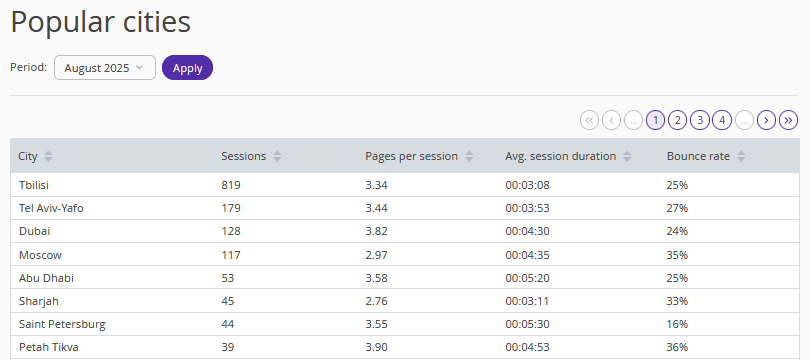
The detailed report table includes:
City — the city from which the visit originated.
Sessions — the total number of sessions started from that city.
Pages per session — the average number of pages viewed per session.
Average session duration.
Bounce rate.
You can select a period in the detailed report to view the relevant data.
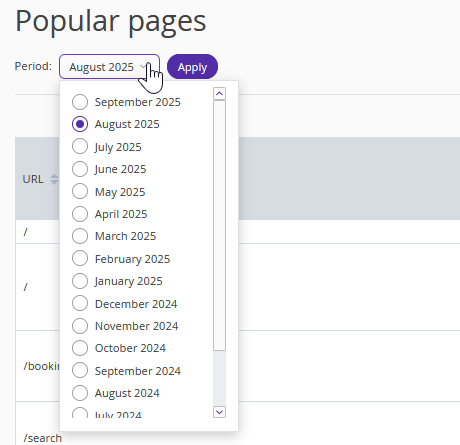
Popular pages
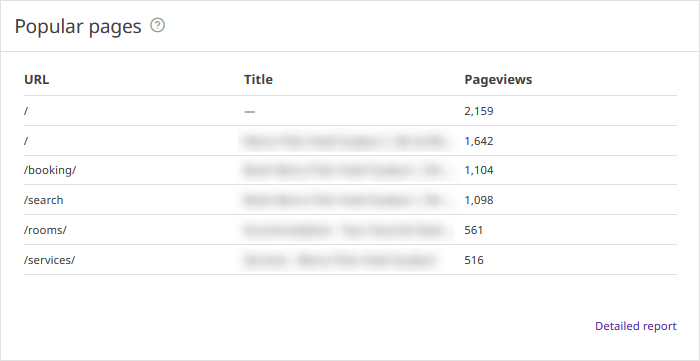
The table shows a list of website pages with the highest number of views for the selected period. It includes the following columns:
URL — the web address of the page.
Title.
Pageviews — the total number of views.
Click “Detailed report” to view the full report — it will be opened in a new tab.
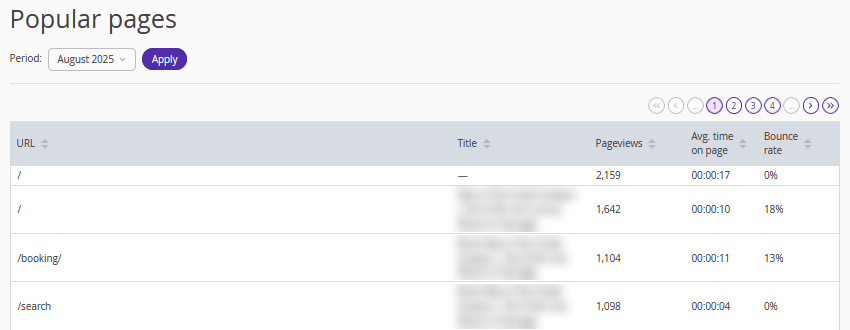
The detailed report table includes:
URL;
the page title;
the number of pageviews;
average time on page;
bounce rate.
You can select a period in the detailed report to view the relevant data.