The "Demand assessment" report is a tool for revenue management. The report allows you to quickly understand if the measures you took to increase the hotel’s occupancy were effective.
In comparison to the "Demand calendar" report, in this report, you can not only see the number of vacant rooms but also assess how quickly they are getting booked.
The data in the report is updated once a day at 05:00 local property time.
How to use the report
Let’s take a look at the use case of the report and how we can work the data out.
1. Let’s see how many rooms are still vacant for a period from July 16, 2026 till August 15, 2026. In the “Control date” field, select July 16, 2026. In the “Analyzed period” field, select the period of time from July 16, 2026 till August 15, 2026.
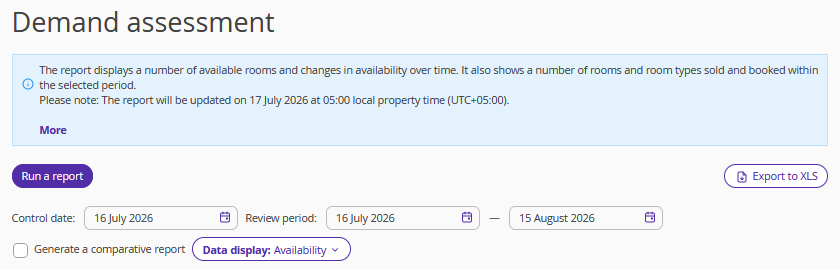
2. In the “Data display” filter, select “Availability”.
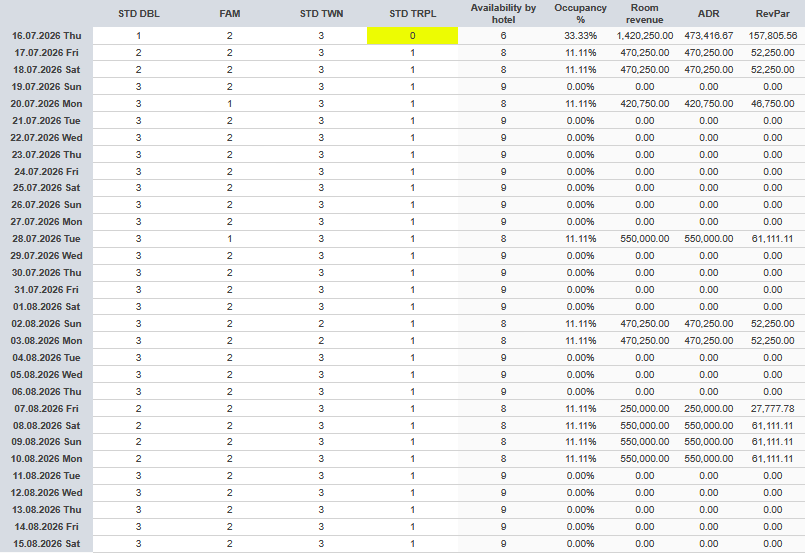
The generated report will show the total number of vacant rooms for each room type on every day of the selected period as of July 16, 2026.
Dates with the full occupancy are highlighted in yellow.
If there are dates with overbookings, the value in the cell will be negative or highlighted in red.
The table displays the hotel’s availability and occupancy rates, revenue from accommodation on each day, ADR, and RevPAR.
2. Let’s suppose that a month ago we introduced measures aimed at increasing occupancy. For example, we created a special offer or set the rate plan with the motivator. And now we want to see if these measures were effective.
Leave the same data in the fields. Tick the “Generate comparative report” check-box. In the “Compare with” field, pick “30 days ago”.
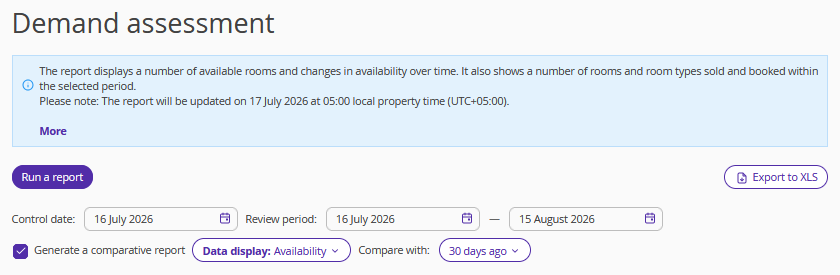
If you need to select a specific date in the past to compare with, in the “Compare with” field, pick “Select”. Then, select the required date.
Pay attention. The date you are comparing with should be before the control date. For example, if the control date is May 1, the date to compare with should be no later than April 30.
We chose to compare with the period 30 days ago. That is why we get a table where we see how the number of available rooms changed.
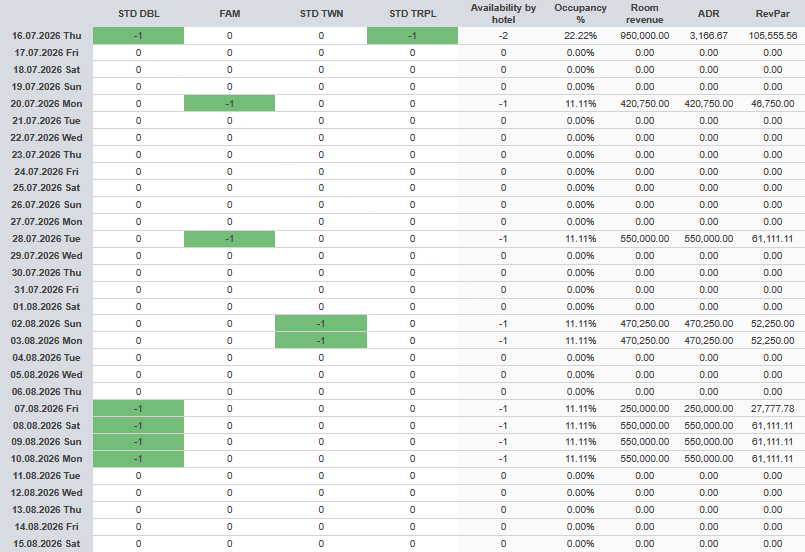
A negative value shows that the number of available rooms has gone down. It means that the dynamic is positive, as the occupancy has gone up. The more the occupancy has risen, the darker the cell is. Cells that have not changed are not colored.
What data are there in the report
In the report, there are the following columns:
Availability by hotel — the total availability for all the room types.
Occupancy % — the percentage of the occupied rooms from the total number of rooms.
Revenue per stay — the cost of stay (taking away the service fee included in the rate plan) within the selected period for all the room types.
ADR — the average daily rate; the ratio of the revenue to the total number of rooms booked.
RevPAR — the average revenue per room; the ratio of the accommodation revenue to the total number of room nights available.