The “Manager report” displays the information on the main property performance metrics.
Pay attention. The data in the report is updated once a day at 10 AM local property time.
The report shows overall analytics for the property in terms of the most important points compared to the previous period.
How to use the Manager report
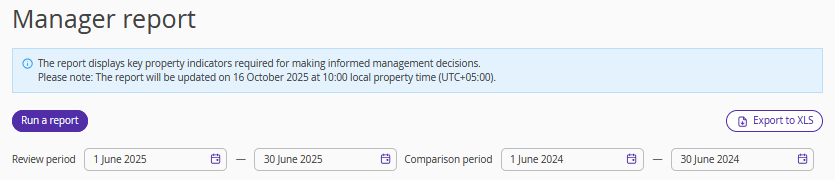
For example, you need to analyse the property’s performance in June 2025 and compare it to the performance in June 2024. To generate a report like this, do the following:
1. For the “Review period”, select the period from June 1 to June 30, 2025.
2. For the “Comparison period”, select the period from June 1 to June 30, 2024.
3. Then, click the “Run a report” button.
A table will be opened showing the property's performance indicators for June of the current and previous years.
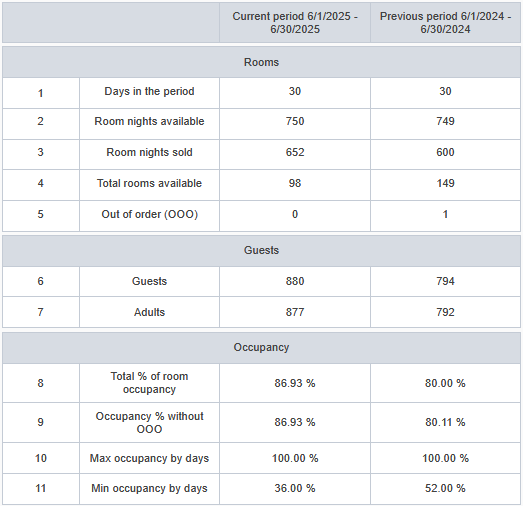
Based on this report, you might draw the following conclusions:
Campaigns aimed at increasing hotel occupancy proved to be ineffective: occupancy fell by 6.93% compared to the same period last year.
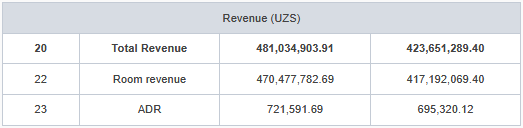
The Average Daily Rate (ADR) has gone down.
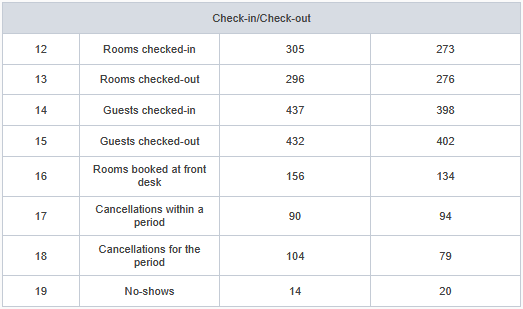
The report shows that the number of cancellations during the period has decreased.
The preferred payment methods used by guests have changed.
Download the report by clicking on the “Export to XLS”.
What metrics are there
The “Rooms” section
Days in the period — the number of days in the selected periods of time.
Room nights available — the number of rooms at the hotel on each day of the selected period by deducting rooms under repair. It is calculated using the formula: Number of rooms — Number of rooms under repair * Number of days in the period.
Room nights sold — the number of room nights that were booked during the selected period of time; it comprises every night of stay for every booking.
Total rooms available — the number of rooms that were vacant during the selected period of time.
Out of order (OOO) — the number of room nights that were under repair during the selected period.
The “Guests” section
Guests — the number of adults and kids (based on the accommodation types). This one only calculates the person-nights. For example, if there are two guests in a booking, and they are staying for two nights, there are four person-nights.
Adults — the number of adults that are staying within the selected dates. For example, if there are two guests in a booking, and they are staying for two nights, there are four person-nights.
The “Occupancy” section
Total % of room occupancy — the hotel’s occupancy metric. It is the ratio of the room nights sold and the total room nights in the hotel. It is calculated using the formula: Room nights sold/ Total room nights in the hotel.
Occupancy % without OOO — the ratio of the room nights sold and the difference between the total room nights in the hotel and the number of room nights under repair. It is calculated using the formula: Room nights sold/ (Total room nights in the hotel — Repair).
Max occupancy by days — the maximum daily occupancy for the selected period. It is calculated using the formula: Number of the occupied rooms/ total number of rooms for each day.
Min occupancy by days — the minimum daily occupancy for the selected period. It is calculated using the formula: Number of the occupied rooms/ total number of rooms for each day.
The “Check-ins/check-outs” section
Rooms checked-in — the number of rooms that checked in within the selected period.
Rooms checked-out — the number of rooms that checked out within the selected period.
Guests checked-in — the number of guests that checked in within the selected period.
Guests checked-out — the number of guests that checked out within the selected period.
Rooms booked at front desk — the number of rooms booked at the reception desk within the selected period.
Cancellations within a period — the number of cancellations of bookings scheduled within the selected period.
Cancellations for the period — the number of cancellations made within the selected period (it does not matter when the actual stays were supposed to be).
No-shows — the number of no-shows for each day of the period. This metric consists of the bookings that were not checked in on the day of the supposed arrival. These are the bookings marked as “no-shows” after they are canceled in the Front desk. Bookings are not considered no-shows if there is another reason for the booking cancellation in the system.
The “Revenue” section
Total Revenue — the revenue for the extra services and booked accommodations. The metric is calculated daily. For example, if a guest stays at the hotel from November 1 to November 10, and the selected period is from November 1 to November 5, then, the revenue for the days between November 6 to November 10 will not be included into the metric.
Room revenue — the accommodation charges that does not comprise the extra service fees, but includes the charges for the early check-ins and late check-outs.
Fines — the fines for the no-show if the booking was made through the Booking Engine and guests’ deposits marked as fines.
ADR — the average daily rate for the selected period. It is calculated using the formula: Charges for stay/ Room nights sold.
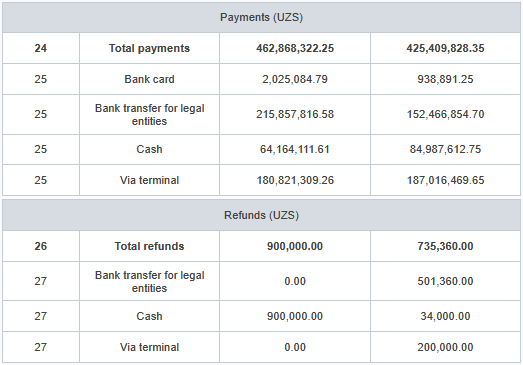
The “Payments” section
Total payments — the amount of money taken as payments within the selected period. There is a sum breakdown based on the payment methods.
The “Refunds” section
Total refunds — the amount of money returned to the guests within the selected period. There is a sum breakdown based on the payment methods.