The "Demand calendar" report in Exely PMS allows you to quickly assess the property occupancy both in numbers and in percent.
For example, the "Demand calendar" report will help to find out what periods in the past peaked in occupancy and during which ones the occupancy was lower. Based on this data, you can fix the property’s pricing strategy to increase the revenue.
Pay attention. The data in the report is updated once a day at 10:00 local property time.
Let’s study the performance of a test hotel.
How to use the report
For example, to see the seasonal changes in occupancy, look at the percentage of occupied rooms on November 1 for the last three years.
Generate three reports for the last three years: 2023, 2024, and 2025.
In the “Year” filter, select the year you need.
In the “Snapshot date” field, select November 1 of the year you selected in the “Year” filter.
In the “Data” filter, select “Occupied rooms”.
Then, click on the “Apply filter” button.
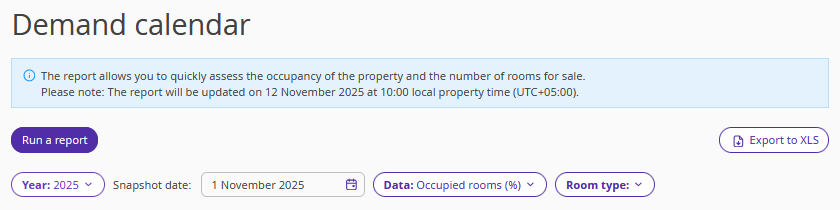
To download the report on the desktop, click on the “Export to XLS” button.
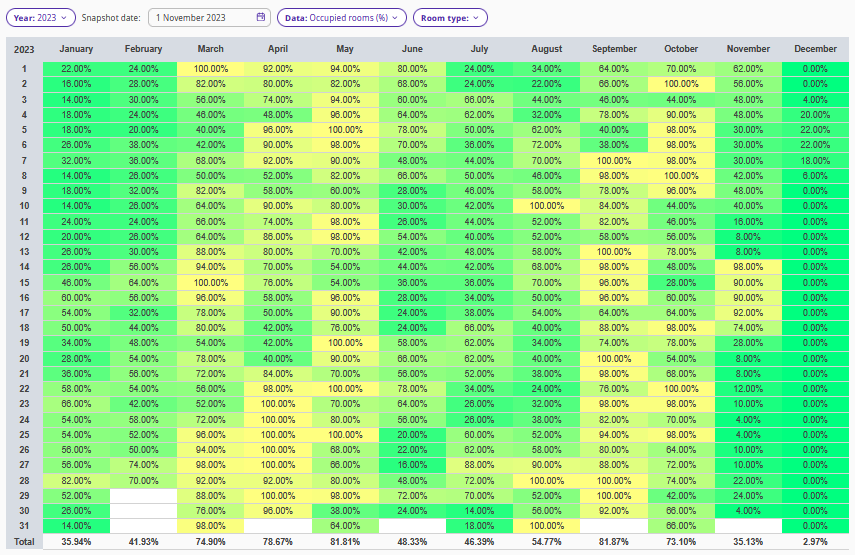
As a result, we get three reports:
1. For the year 2023, we selected Year: 2023; snapshot date: November 1, 2023; Data: Occupied rooms (%); Room type: all.
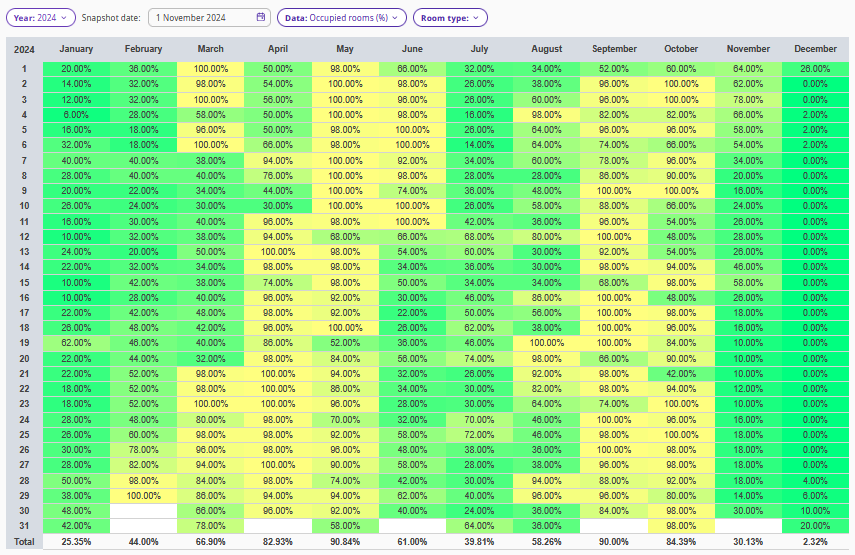
2. For the year 2024, we selected Year: 2024; snapshot date: November 1, 2024; Data: Occupied rooms (%); Room type: all.
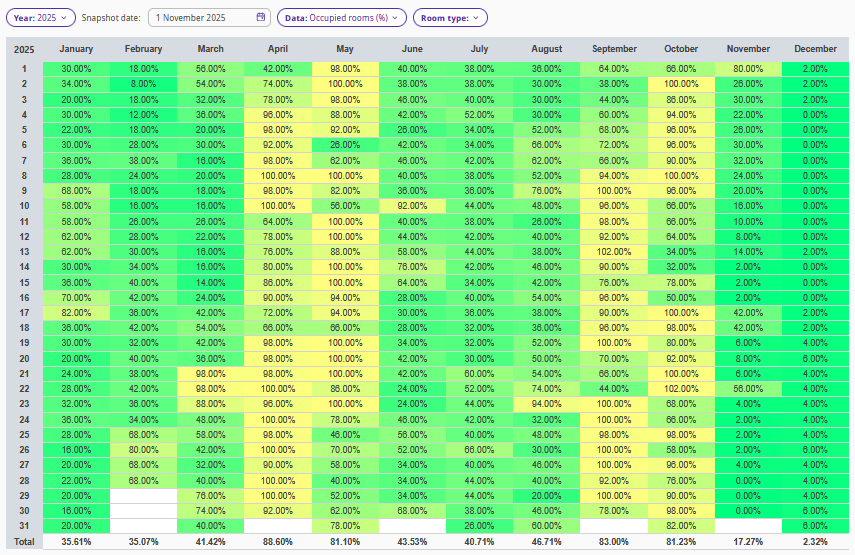
3. For the year 2025, we selected Year: 2025; snapshot date: November 1, 2023; Data: Occupied rooms (%); Room type: all.
Compare the reports to find out the periods with the peak occupancy and the ones with the lower occupancy. You can take this data into account when considering the property’s pricing strategy for future periods.
Highlighted numbers stand for the occupancy percentages:
Number in green — the minimum occupancy rate.
Number in yellow — the maximum occupancy rate.