The "Rate plan revenue" report allows you to thoroughly study the performance of rate plans. It allows you to find out :
what rate plan is booked the most;
what room category is the most popular and at what rate plan guests book it;
what revenue each rate plan generates;
how many guests stayed under each rate plan and for how long.
Pay attention. The data in the report is updated once a day at 10:00 local property time.
How to generate the report:
1. To change the reporting period, select the date range and click “Run a report”.
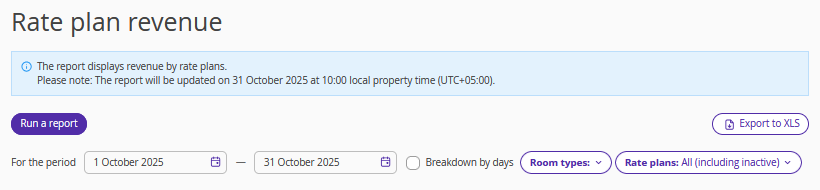
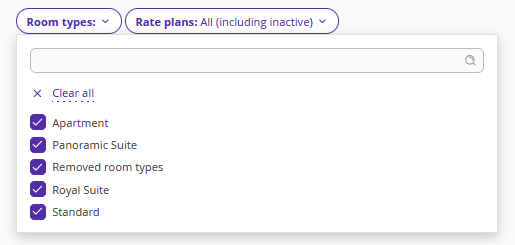
2. To generate the report for one or more specific room types, use the “Room type” filter.
3. To view daily data in the report, tick the “Breakdown by days” check-box.
4. To generate the report for a specific rate plan, select the required rate plan in the “Rate plans” filter.
5. Click “Run a report”.
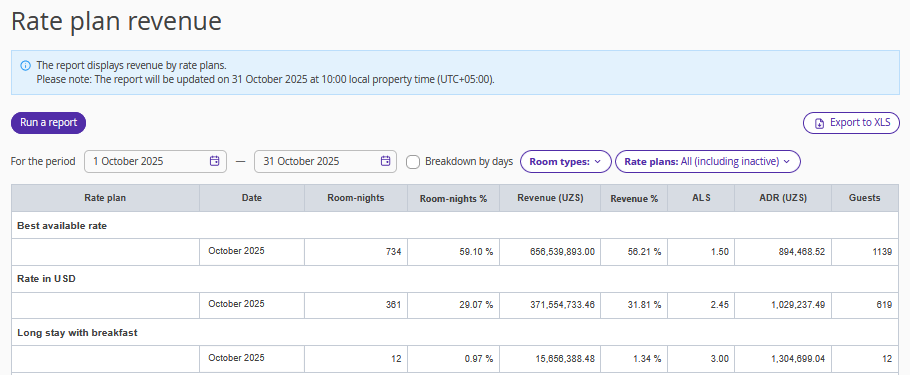
In the table, you can find the following data:
Rate plan — a rate plan name.
Date — monthly data.
Room-nights — the number of room nights booked at the rate plan.
Room-nights % — the percentage of the room nights booked at the rate plan from the total number of room nights sold.
Revenue — revenue from the rate plan. For details on how the revenue is counted, refer to the article “Notions of Revenue and Payment”.
Revenue % — the percentage of revenue from the rate plan from the total revenue for the selected period.
ALS — the average length of stay at the rate plan for the period (day/month) if a room was checked in on this day/in this month. ALS = Total number of room nights/Number of bookings.
ADR — the average room price per night for stays under the rate plan within the selected period. Room revenue for the selected dates / Number of stays for the selected dates.
Guests — the number of beds sold under the rate plan within the selected period.
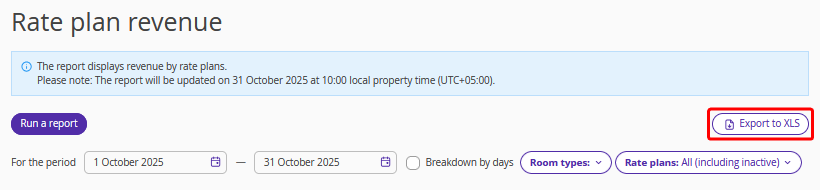
To export the report data to Excel, click the "Export to XLS" button.