Smarter Management Decisions Start with Exely Analytics
Request DemoTrack Revenue Drivers and Demand Patterns
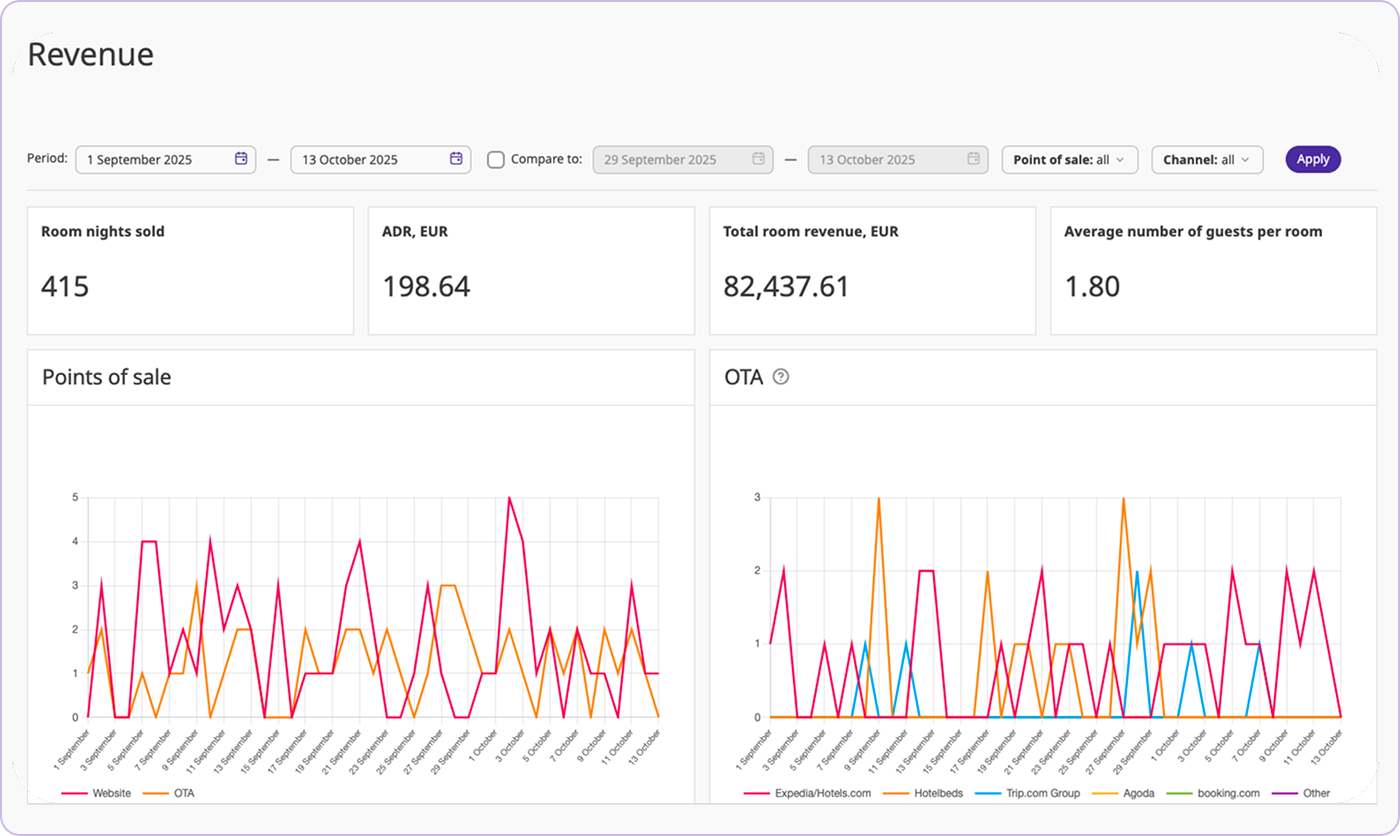
Understand how sales pace, occupancy, cancellations, and booking windows shape your revenue performance.
-
KPI Overview
Understand how sales pace, occupancy, cancellations, and booking windows shape your revenue performance.
-
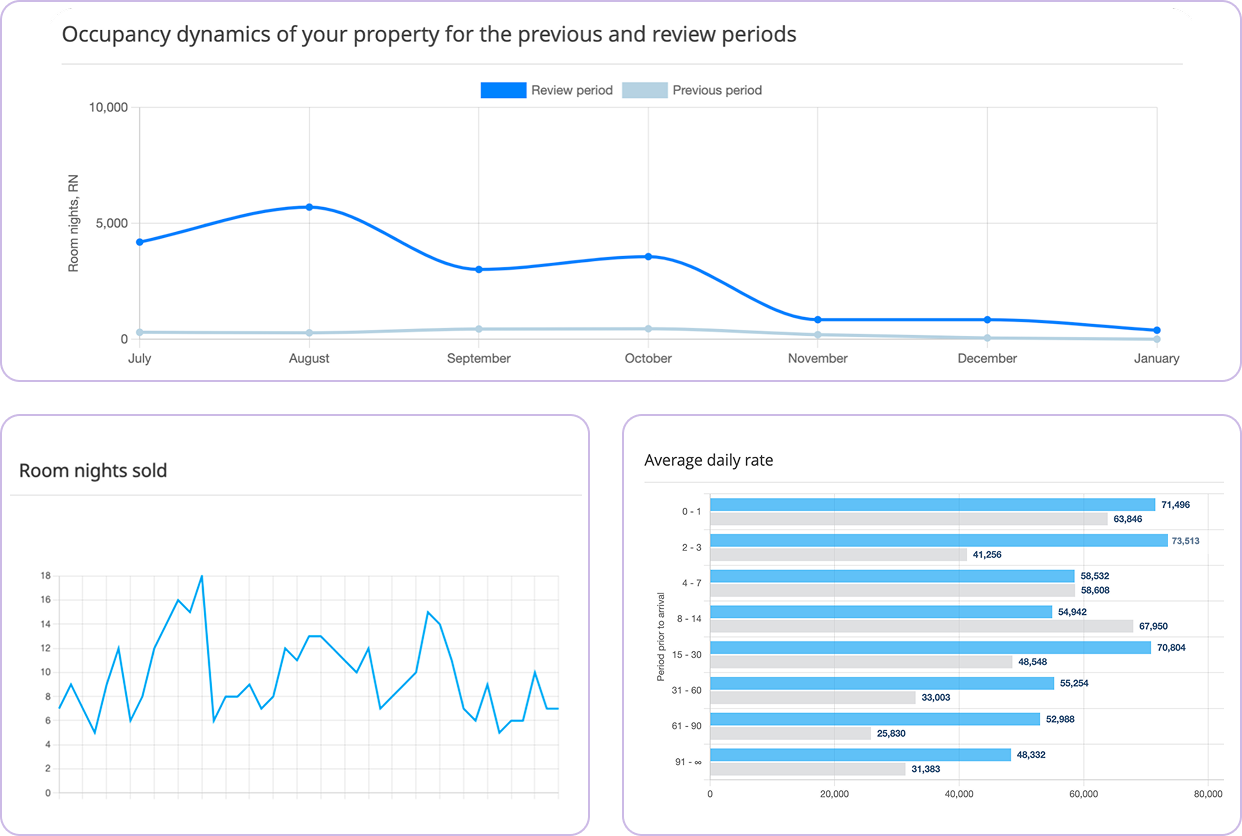
Occupancy Dynamics
Presents historical room night sales with comparisons across periods to reveal seasonality and support pricing strategy.
-
Room Nights Sold
Illustrates how room night sales are distributed across dates, reflecting booking activity rather than stayed nights.
-
Occupancy Pickup & Cancelled Room Nights
Highlights how bookings accumulate over time before arrival, and how cancellations affect final occupancy.
-
Booking Lead Time
Shows how far in advance website guests book compared to guests booking through OTAs.
-
Cancellation Windows
Explores cancellation behaviour and typical time windows between booking, cancellation, and arrival.
-
ADR Performance
Reveals rate trends for evaluating pricing effectiveness.
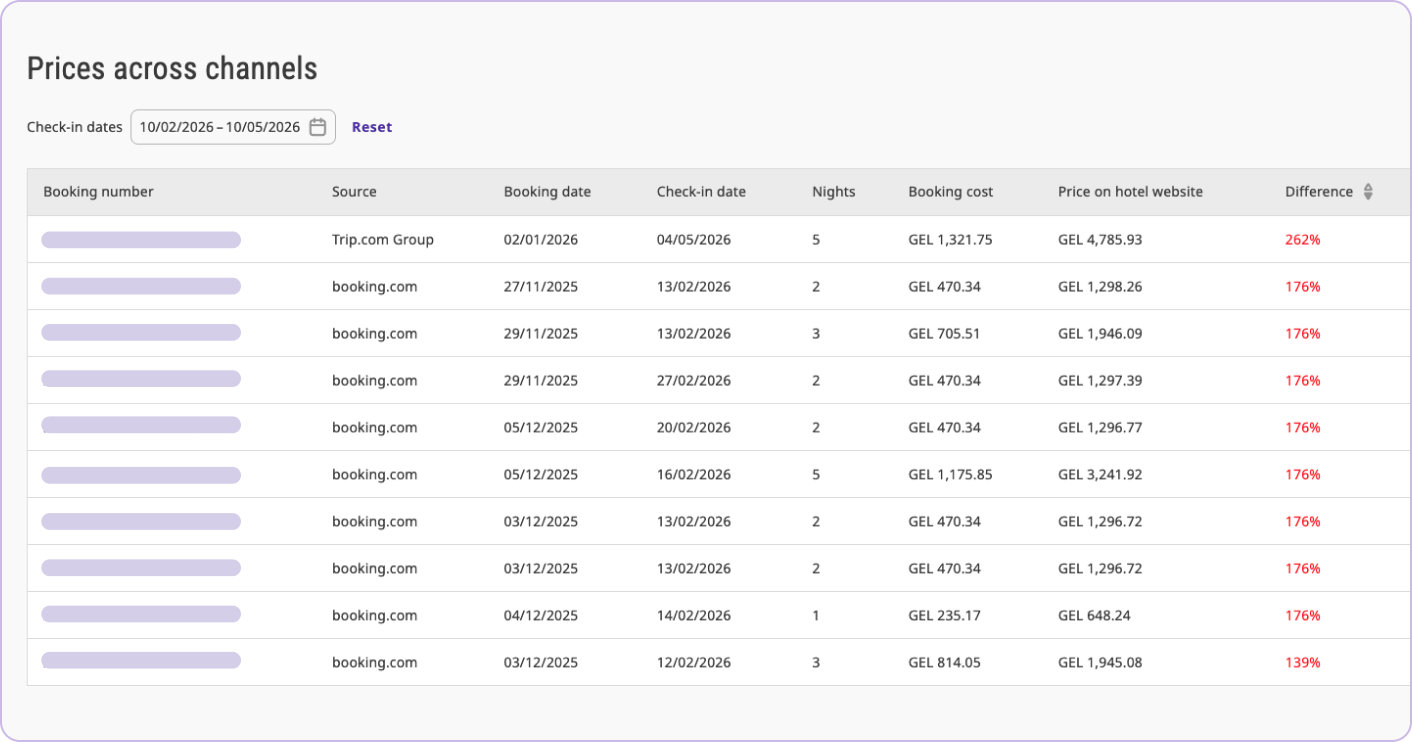
See Which Channels Fill Rooms or Create Losses
Understand which channels generate profitable bookings, where price disparities appear, and how channel contributes to revenue.
-
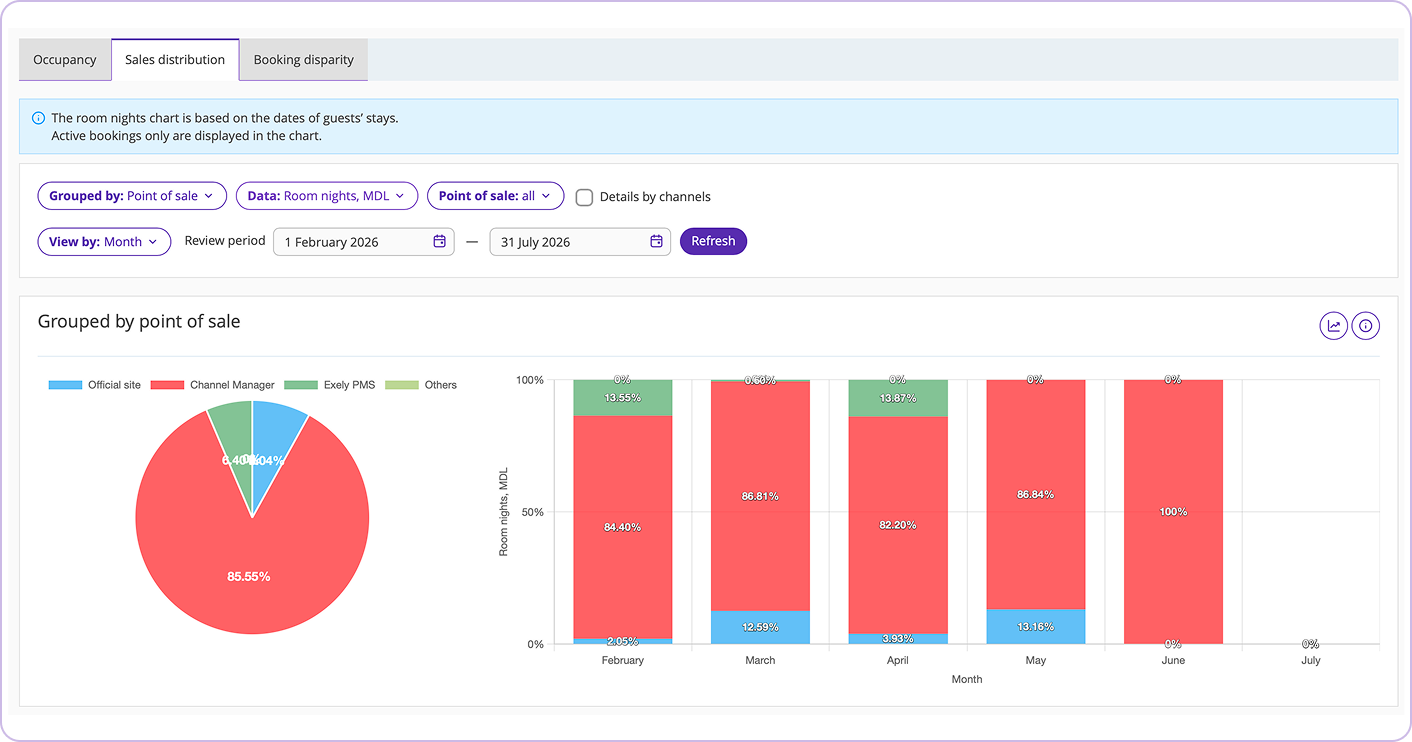
Explores how bookings are distributed across channels, rate plans, and room types to reveal where different offers sell best.
-
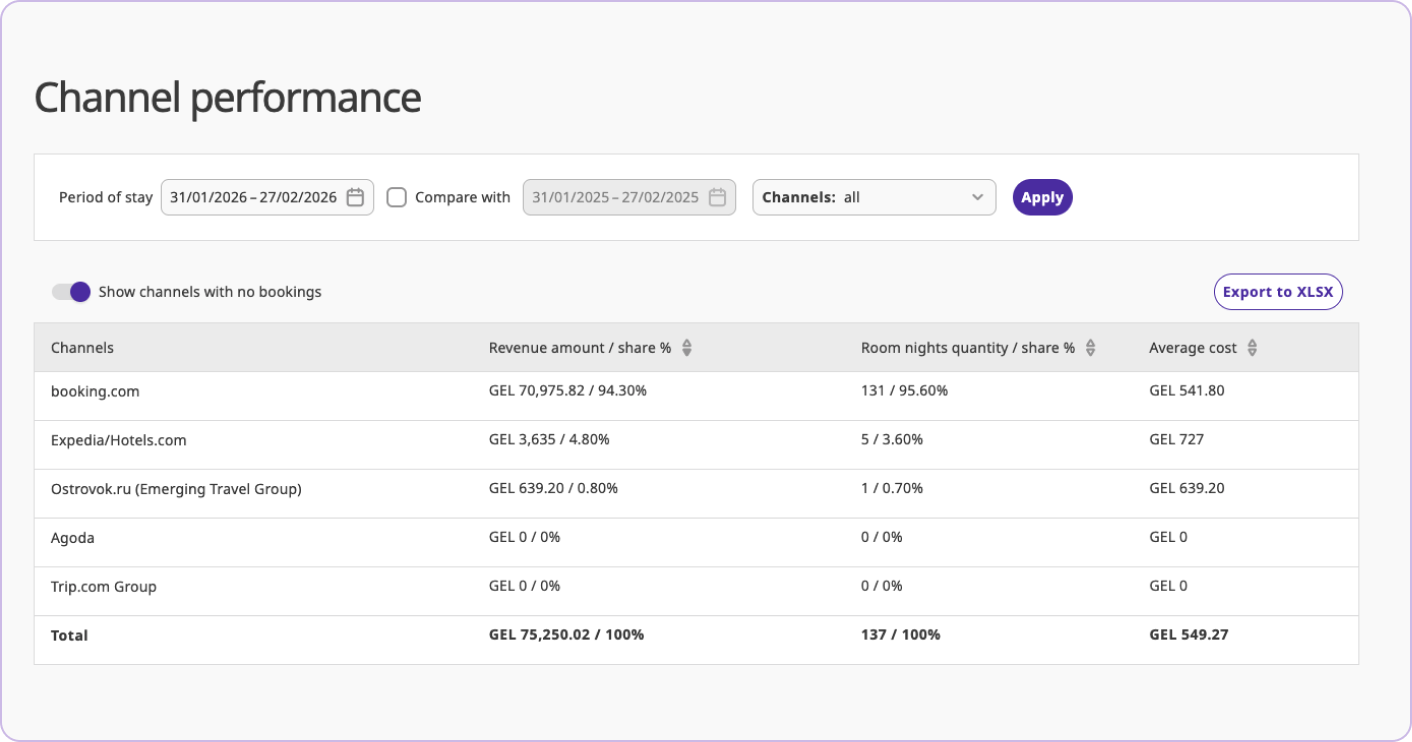
Shows the profitability of each channel with performance comparison over time.
-
Highlights price differences across channels and shows OTA bookings made at rates lower than the website price.
Understand Traffic to Improve Conversion
See how guests move interact with your website, where interest drops, and which sources bring visitors most likely to book.
-
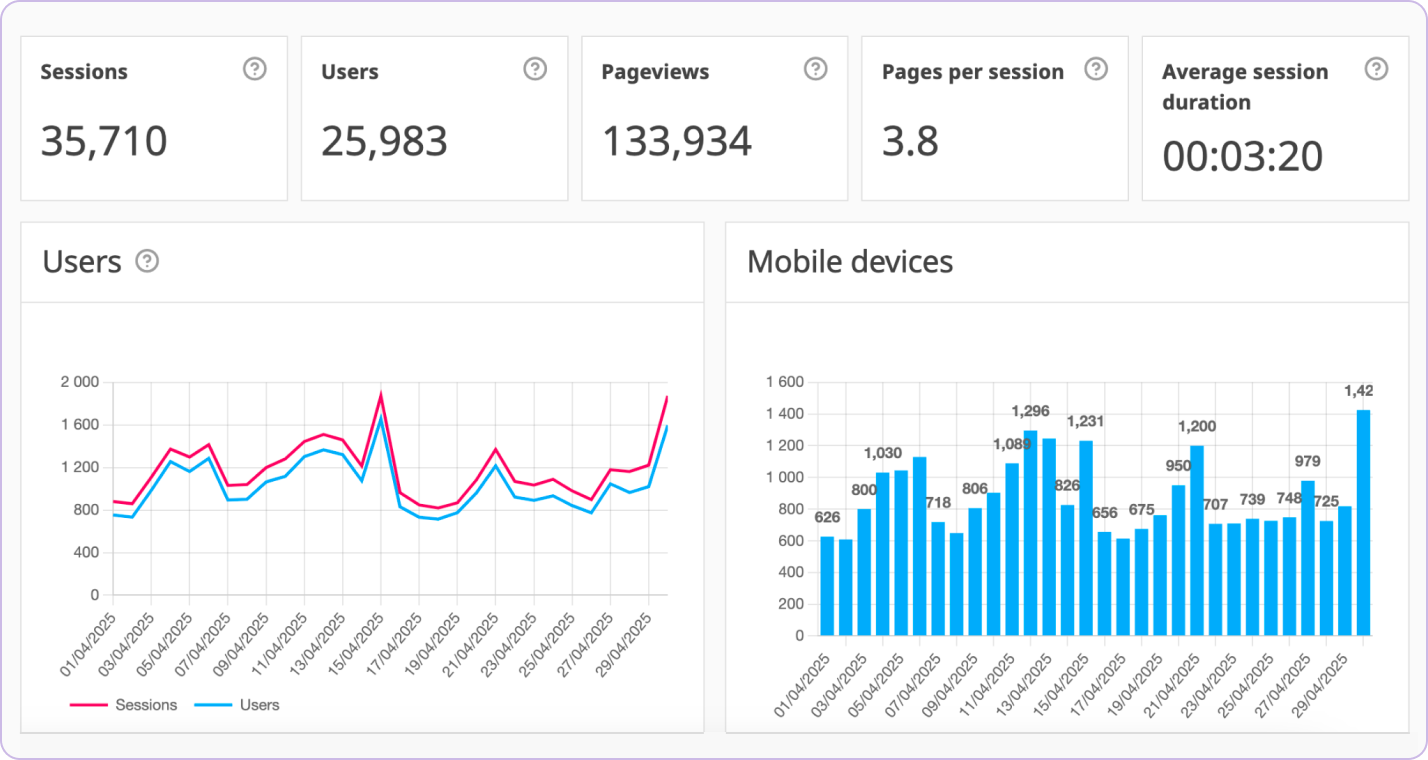
Engagement Metrics
Shows how visitors interact with your website to reflect overall interest and browsing depth.
-
Audience Overview
Provides daily visitor numbers and highlights where users come from, which devices they use, and which pages attract the most attention.
-
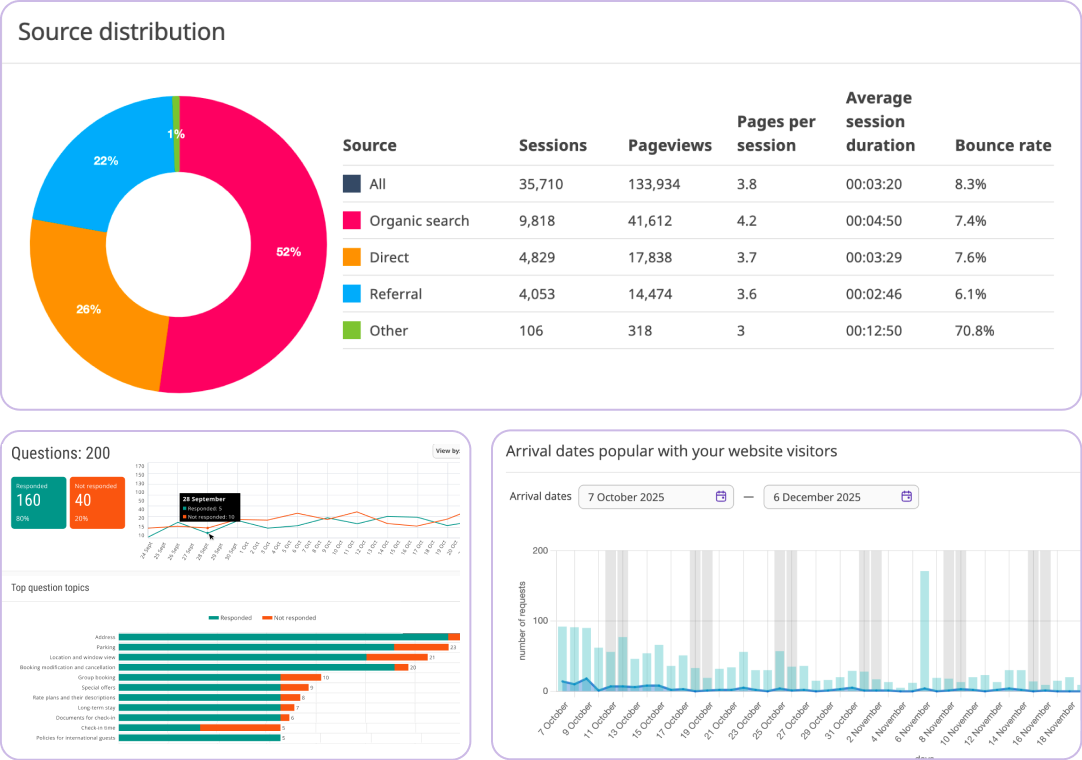
Traffic Sources
Breaks down broad categories like organic and referral into specific platforms and shows how each source contributes to traffic.
-
Website Demand Calendar
Highlights stay dates visitors search for and reveals dates where no rooms were available on the website.
-
AI Website Request Insights
Analyzes questions and requests from website visitors to highlight missing content and booking barriers.
-
AI Website Quality Scoring
Evaluates strengths and gaps in website content that affect AI search visibility and guest experience.
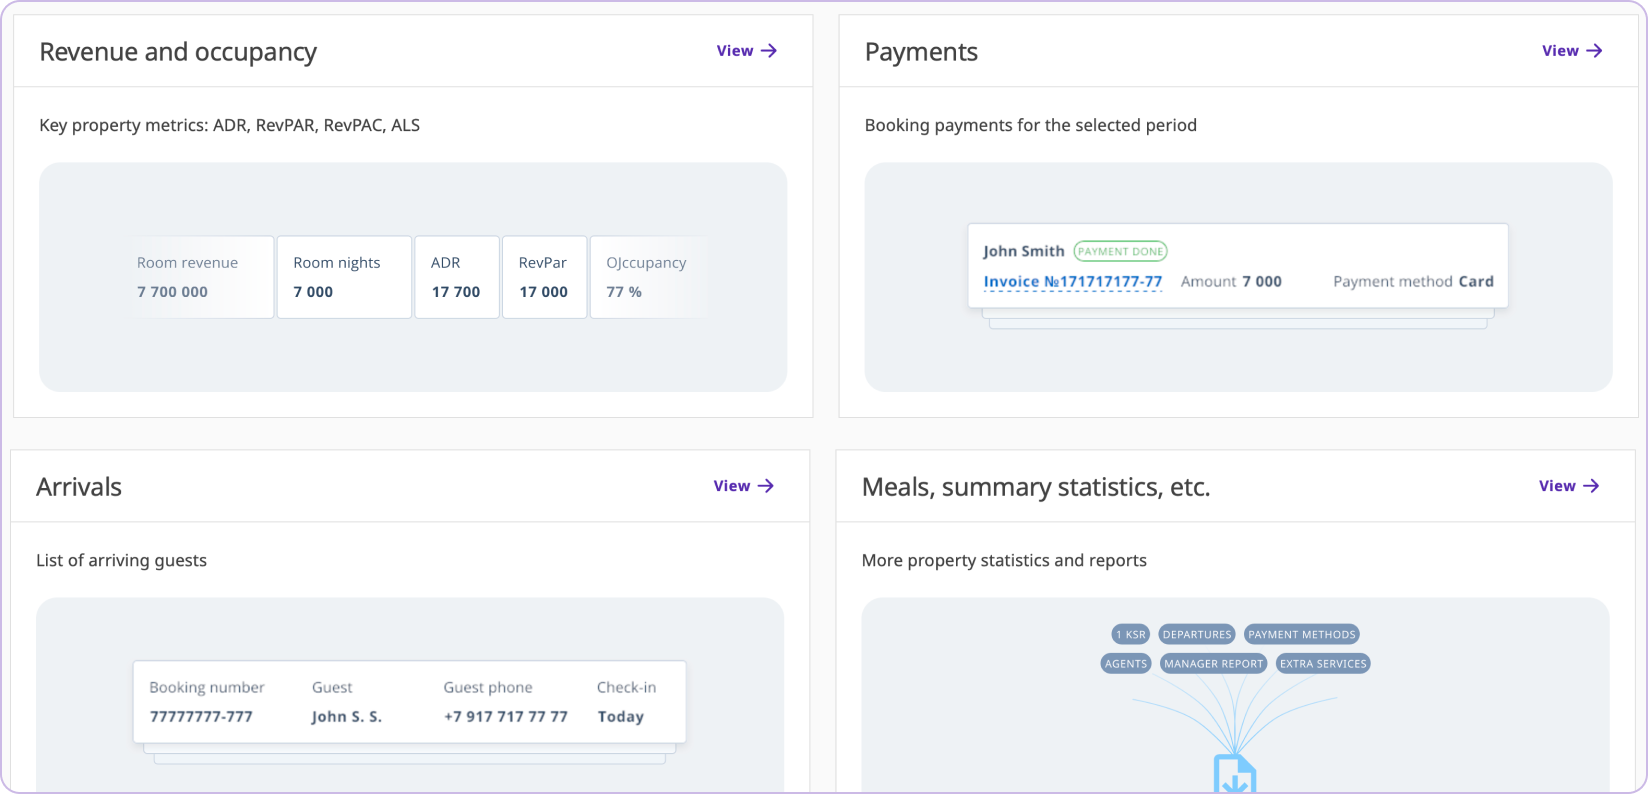
See the Daily Numbers Your Team Can Rely On
Track operational data in one place, from arrivals and departures to payments and housekeeping. Plan staffing and resources more accurately every day.
-
Arrivals & Departures
Displays all expected check-ins and check-outs for the selected date.
-
Occupied Rooms & Guest Lists
Provides real-time occupancy rate and detailed guest information.
-
Payments & Payment Methods
Shows received payments grouped by method to support financial control.
-
Extra Services & Meals
Tracks ancillary revenue and usage of extra services and meal plans.
-
Housekeeping
Presents room status and cleaning progress to support daily housekeeping planning.
-
User Activity Log
Records staff actions and system changes for operational transparency.
-
Manager Report
Summarizes key operational indicators for a quick managerial review.
-
Booking Balance & Daily Financial Report
Indicates revenue totals, adjustments, and financial balances across all bookings.
See What Guests Think and Improve What Matters
Understand guest feedback, loyalty behavior, and repeat bookings to strengthen satisfaction and retention.
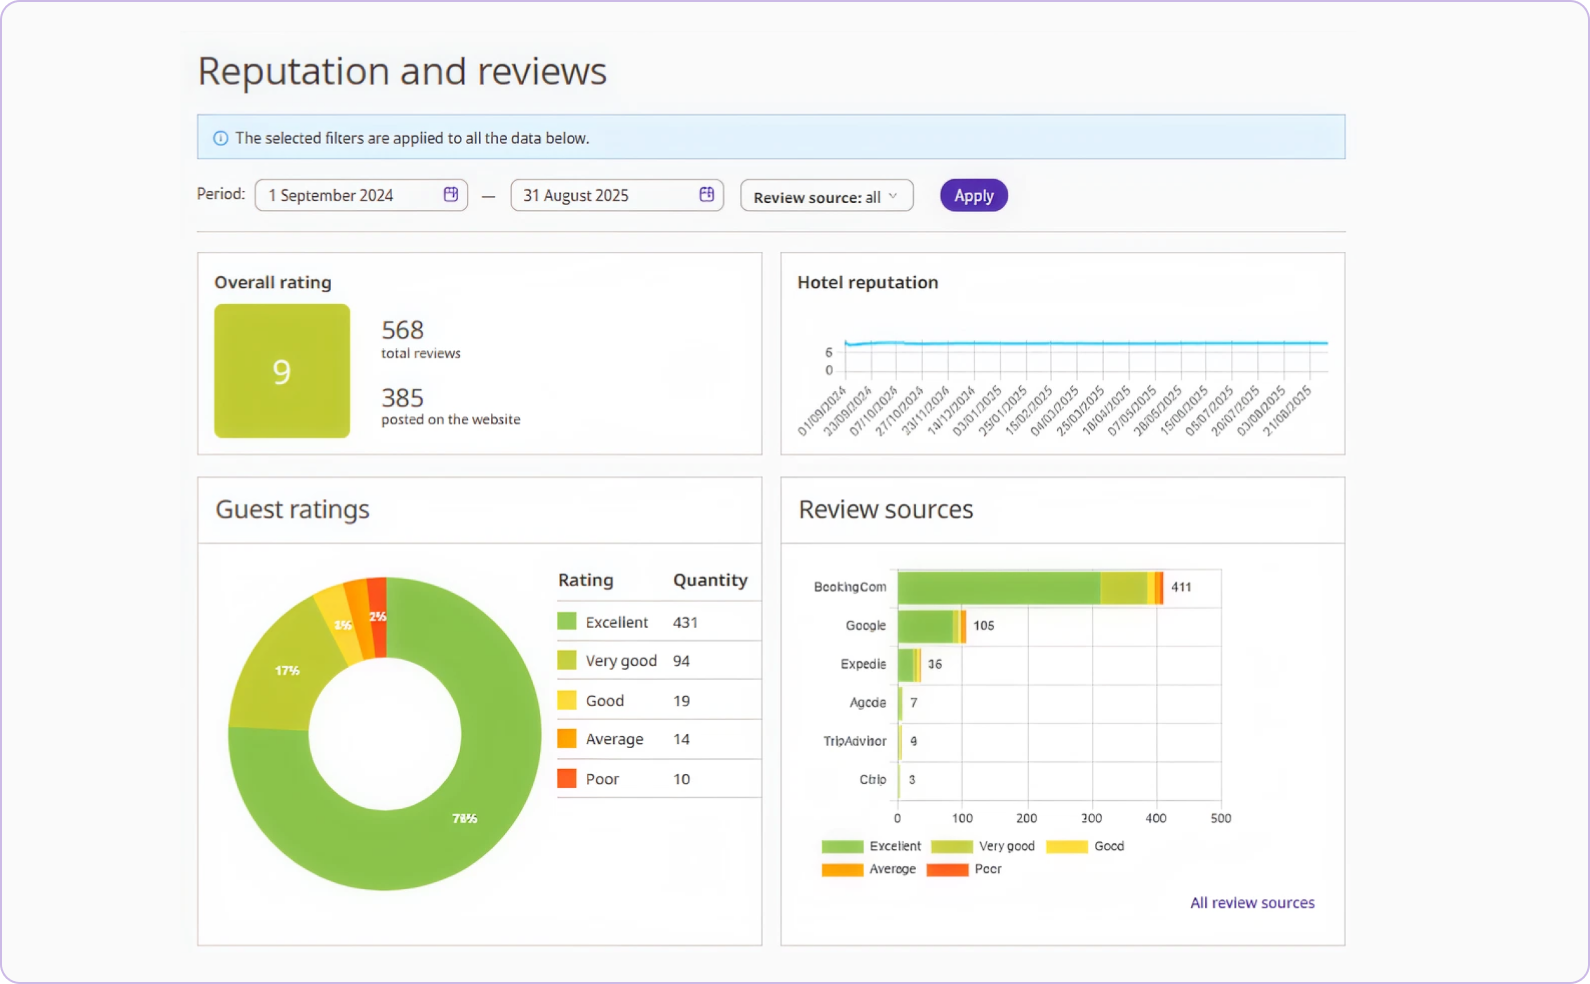
-
Review Score Overview
Tracks the average score, review distribution by score and by source, and how the rating changes over time.
-
Guest Segment Profiles
Shows how different guest segments book, spend, and interact with the property.
-
Mailing Performance
Measures open rates, clicks, and guest actions to evaluate the effectiveness of email campaigns.
-
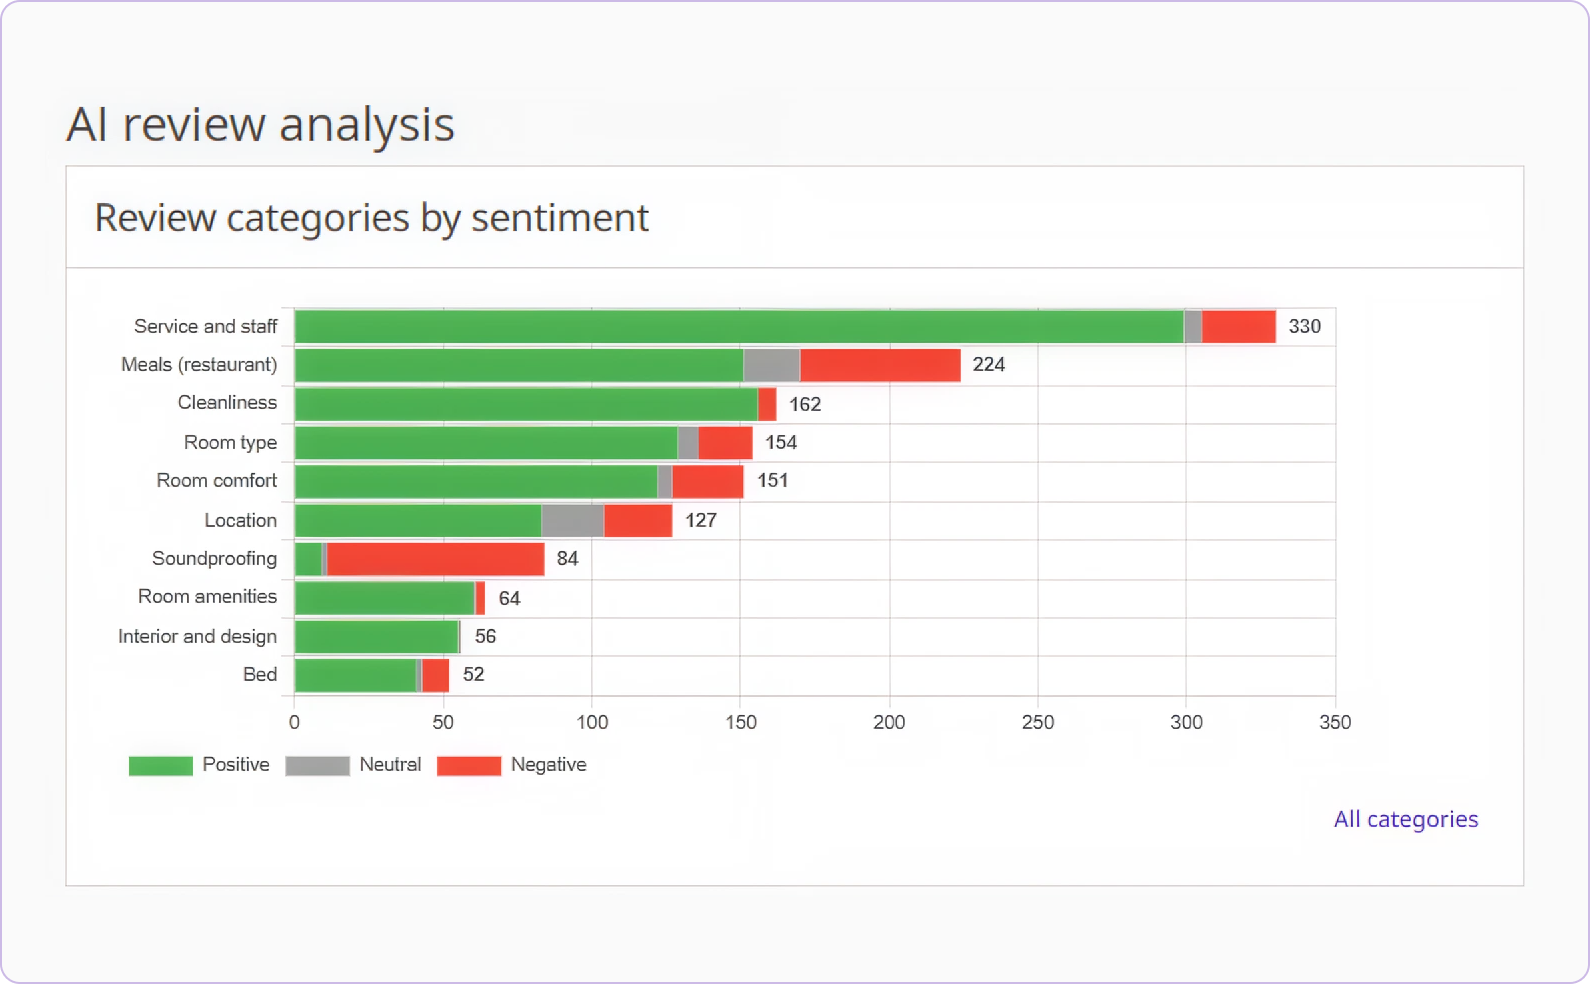
Sentiment by Room Type & Facility
Reveals positive and negative themes grouped by service area or room category.
-
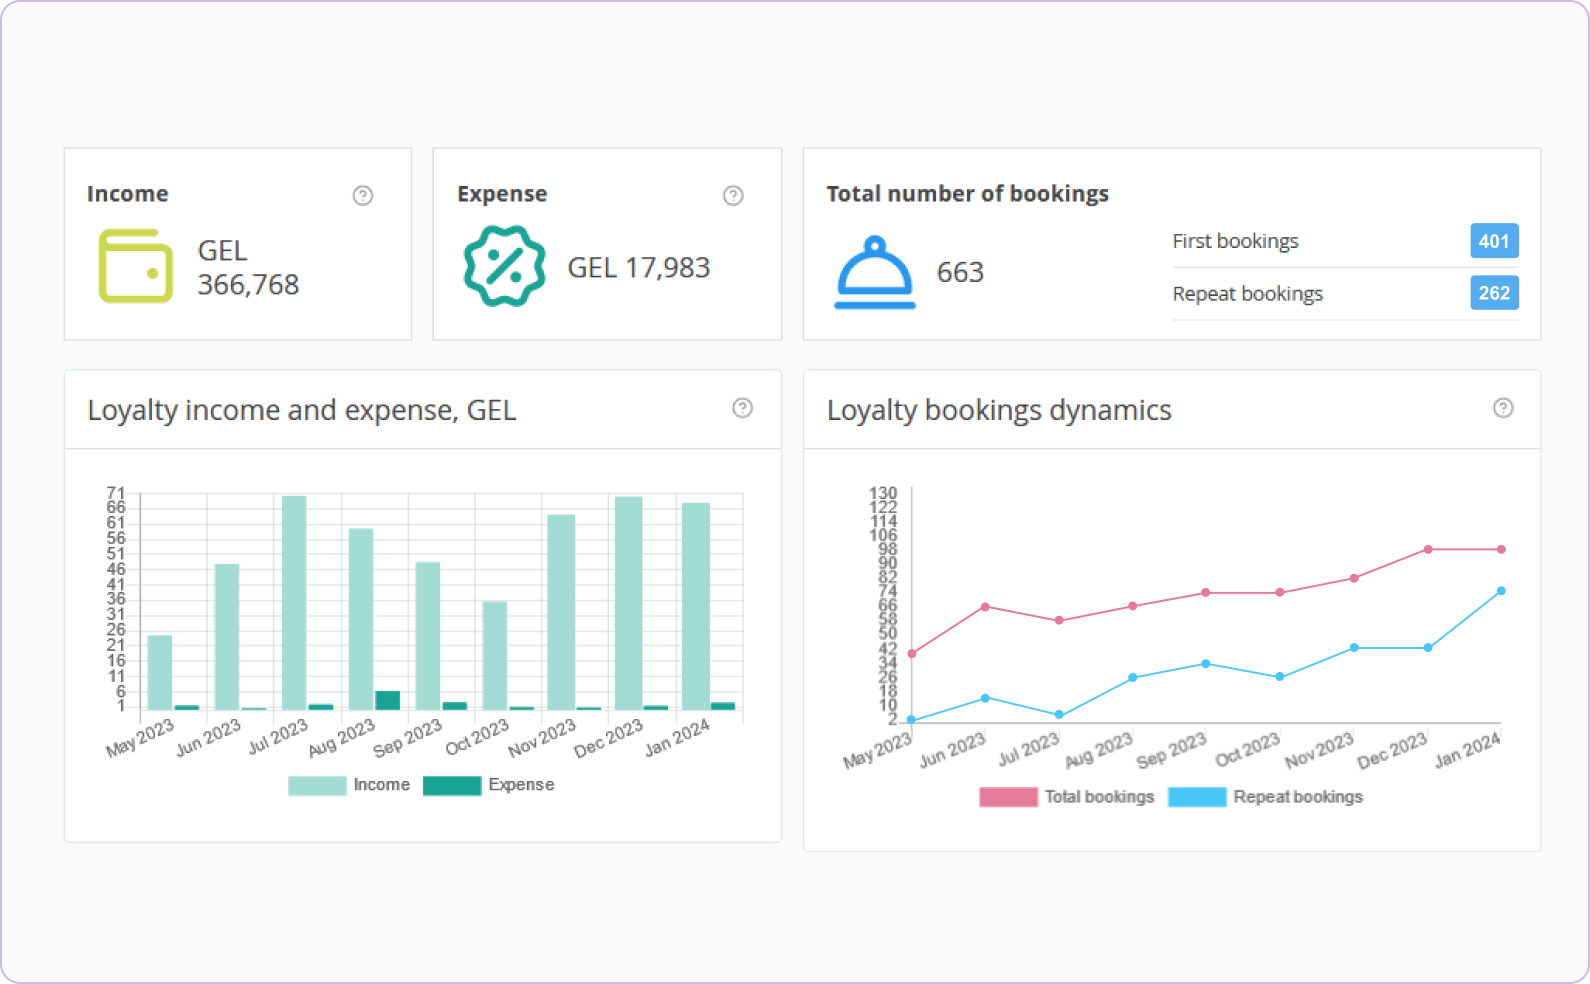
Loyalty Program Finance
Calculates loyalty program income and expenses and how they change over time.
-
Repeat Booking Dynamics
Highlights how repeat bookings contribute to the total number of bookings over time.
Turn Your Hotel’s
Data Into Actions
See how connected analytics can improve your direct sales, operations, and guest satisfaction.