The "Statistics" section helps properties measure the performance of their loyalty program and make data-driven decisions.
How to decide whether to increase a discount
Suppose you are considering increasing the discount for the second level of the Loyalty Program from 5% to 10%, but want to make sure that the additional discount costs are offset by higher revenue and more repeat bookings.
Use the statistics to:
compare revenue with the total amount of discounts applied;
check whether guests at the selected level return more often;
compare performance across different periods and individual revenue sources.
Compare the data on the "Financials" and "Guest activity" tabs. The cost of discounts should be offset by an increase in revenue or the number of repeat bookings.
How to view the statistics
Go to “Guest connections” > “Loyalty program” > “Statistics”.
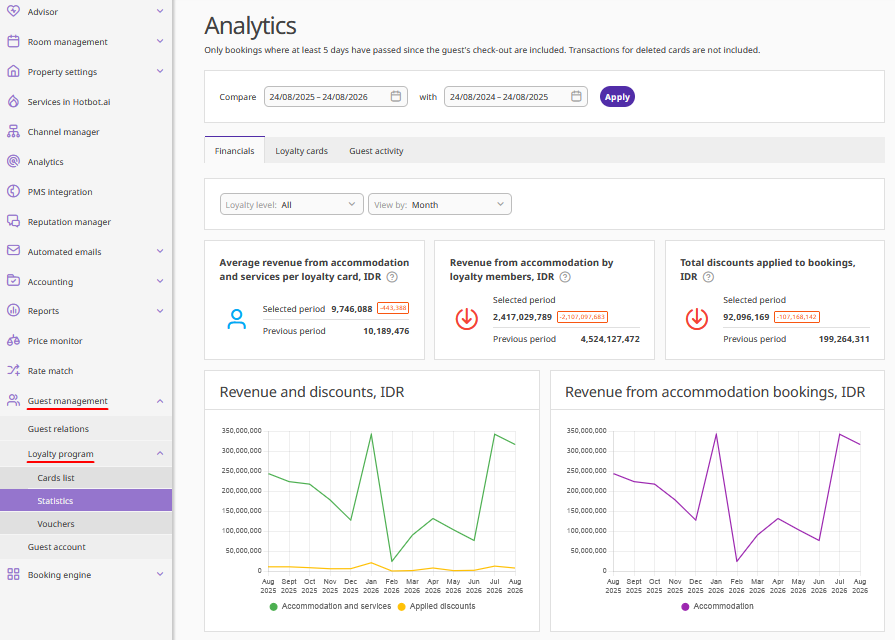
The “Statistics” section includes the following tabs:
Financials
Loyalty cards
Guest activity
Points — available only for points-based loyalty programs
Note. If the loyalty program is set up for a hotel group, the statistics are displayed for the entire group, not individual properties.
How to select comparison periods
You can compare metrics across two time periods, such as the current month and the previous month. The periods can be selected automatically or manually.
Automatic period selection
When you open the page, the duration of the Loyalty Program is determined automatically, and two periods of equal length are selected:
Less than 14 days — the last 2 days are compared with the previous 2 days.
14 days to 2 months — the current week is compared with the previous week.
2 months to 2 years — the current month is compared with the previous month.
2 years or more — the current year is compared with the previous year.
This ensures that the comparison does not include dates before the loyalty program was launched.
Manual period selection
You can also compare custom periods of any length.
1. Click the date field to change the periods.
2. Select the required date ranges in the calendar.
3. Click “Apply”.
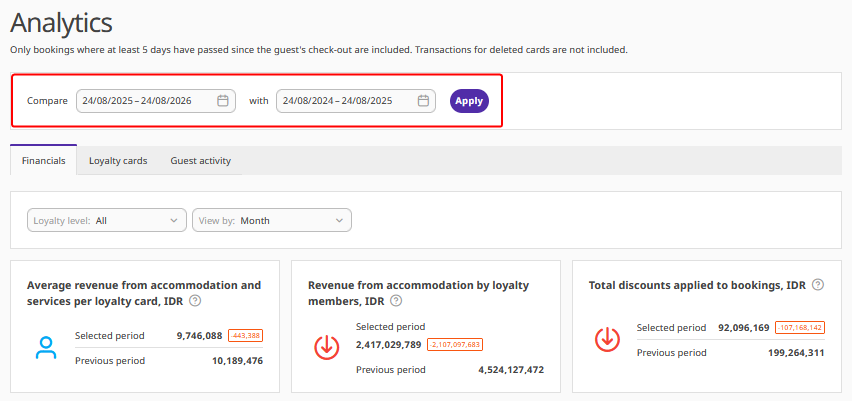
4. Then go to the tab with the required metrics. The selected periods are preserved when you switch between tabs.
Pay attention. The calendar does not allow you to select:
future dates, starting from tomorrow;
dates before the loyalty program was launched or before the first loyalty card was issued.
How to group chart data
You can group chart data by day, week, month, quarter, or year.
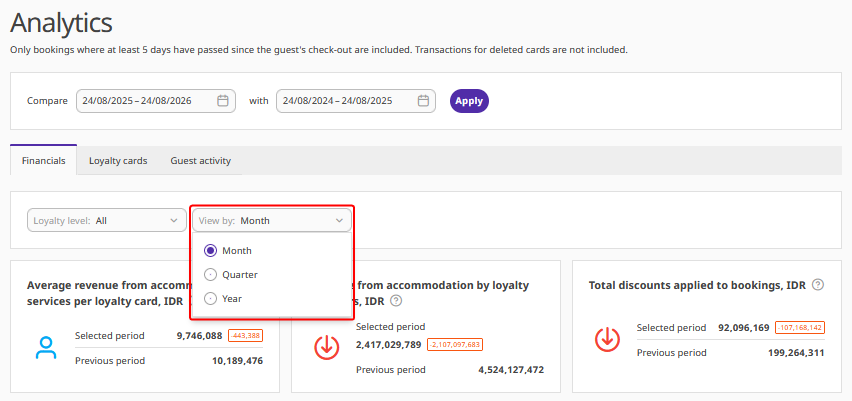
The grouping options depend on the length of the selected period. For example:
For date ranges from 1 to 6 days, only daily grouping is available.
For date ranges longer than 1 year, daily grouping is unavailable to keep the chart easy to read.
Financials
The “Financials” tab shows the revenue generated by loyalty program members and the amount spent on discounts or loyalty points. All amounts are shown in the loyalty program currency.
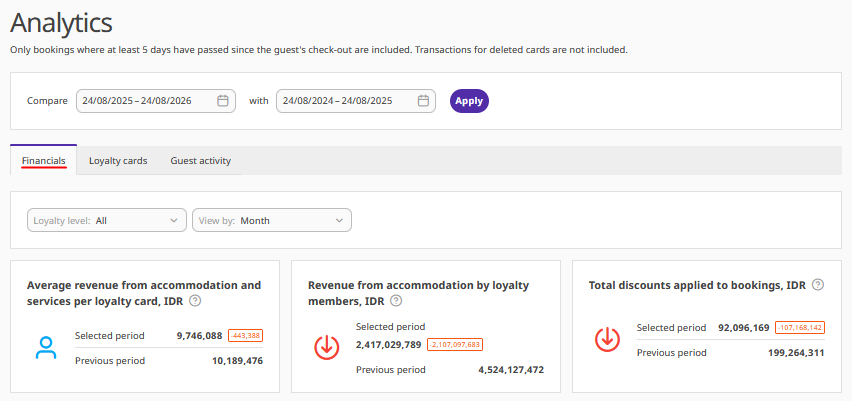
You can filter the data by:
loyalty card level;
card source (on the "Loyalty cards" tab);
revenue source (on the “Guest activity” tab): Exely Booking Engine, Exely PMS, or external PMS.
The available metrics depend on the type of loyalty program.
Financial metrics and charts for the discount-based program
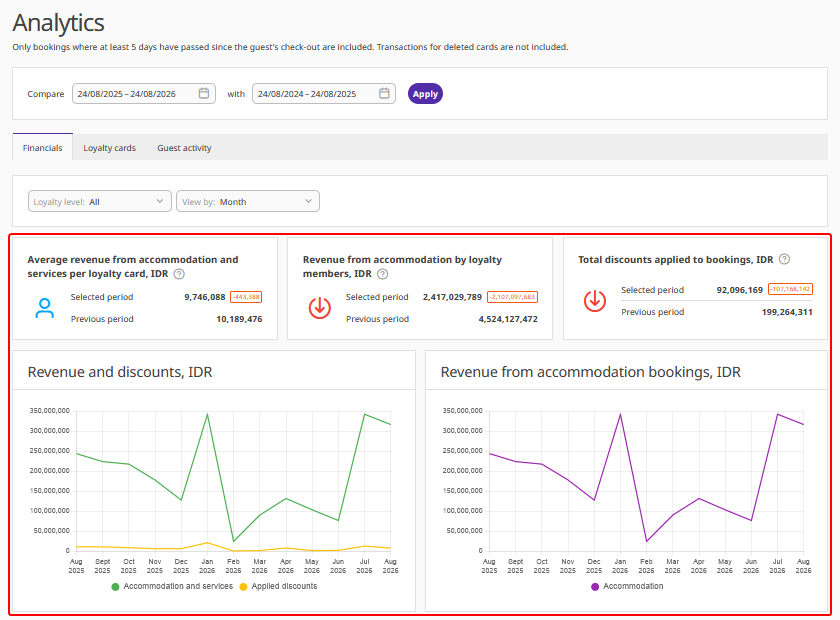
Average revenue from accommodation and services per loyalty card — the average revenue generated per loyalty card. It is calculated by dividing the total revenue by the number of unique loyalty cards used during the selected period.
Revenue from accommodation by loyalty program members — revenue from accommodation and services included in bookings made by loyalty program members. It includes bookings from the booking engine, channel manager, Exely PMS, another PMS, and API.
Revenue from external system services — revenue from extra services imported through the Exely Connect API.
Total discounts applied to bookings — the total amount of discounts applied to bookings made by loyalty program members, including those for registration, loyalty level, and vouchers.
The "Revenue and applied discounts trend" chart lets you compare booking revenue with the cost of discounts granted. The "Revenue from accommodation bookings" chart lets you compare the trends of the two revenue sources and identify what drives changes in the overall loyalty program revenue.
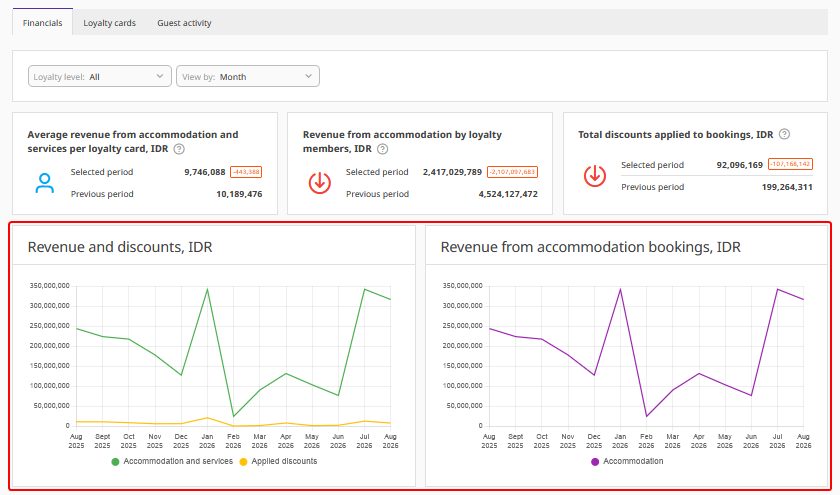
To evaluate the effectiveness of a discount, select the required card level and compare the revenue with the total discounts applied for comparable periods.
Financial metrics and charts for the points-based program
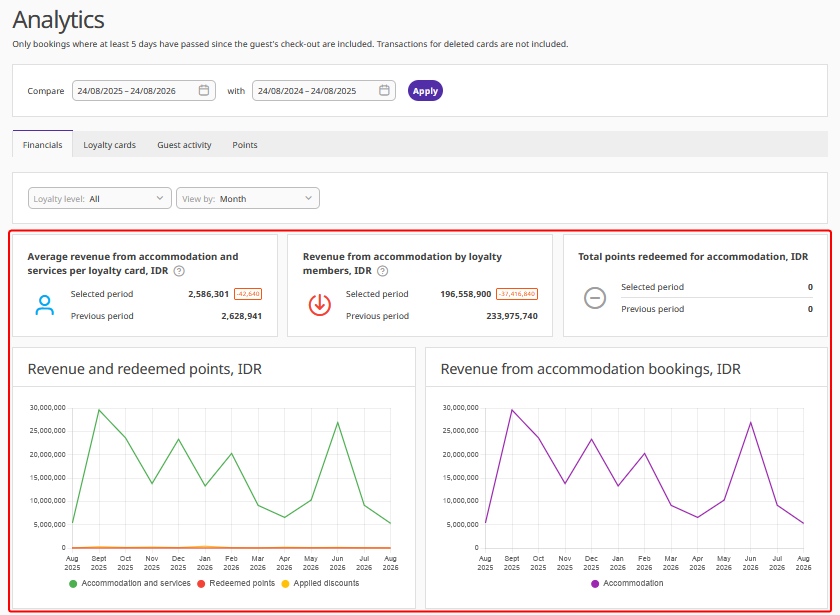
Average revenue from accommodation and services per loyalty card — the average revenue generated per loyalty card. It is calculated by dividing the total revenue by the number of unique loyalty cards used during the selected period.
Revenue from accommodation by loyalty members — revenue from accommodation and services included in bookings made by loyalty program members.
Total points redeemed for accommodation — the monetary equivalent of points redeemed by guests to pay for accommodation through the booking engine or API.
Revenue from external system services — revenue from services imported through Exely Connect API.
Total points redeemed for external system services — the monetary equivalent of points redeemed by guests to pay for services in external systems.
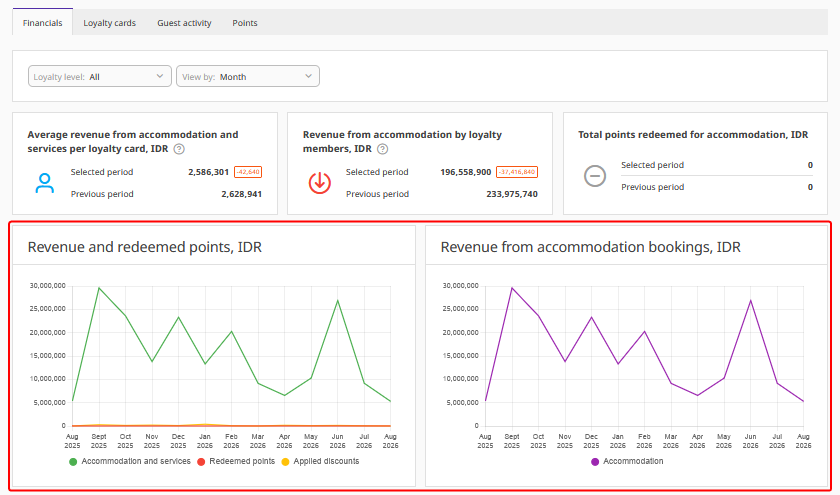
The “Revenue and redeemed points” chart compares revenue with the monetary equivalent of points redeemed for accommodation and services. The "Revenue from accommodation bookings" chart lets you compare the trends of the two revenue sources and identify what drives changes in the overall loyalty program revenue.
Loyalty cards
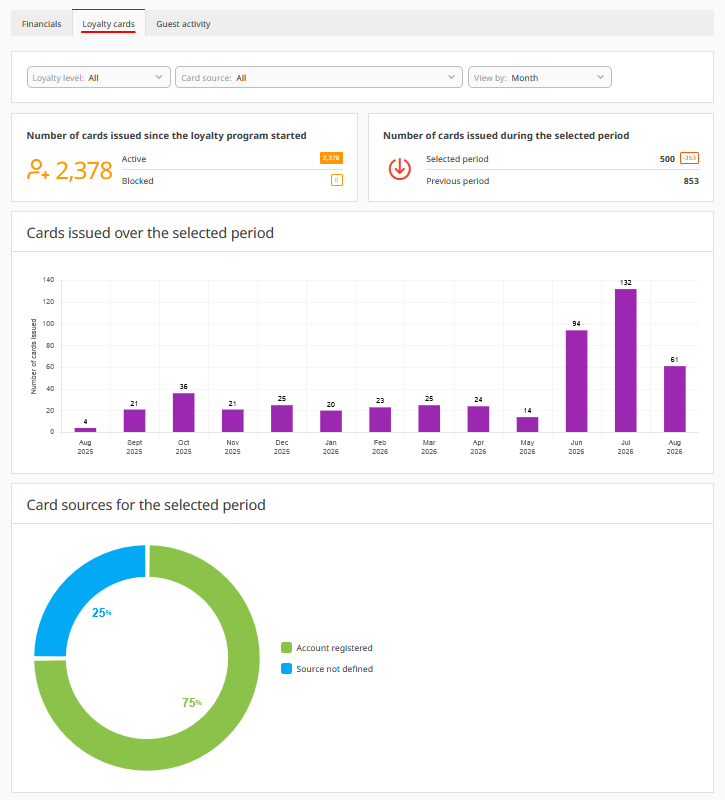
The “Loyalty cards” tab shows how your loyalty program membership is growing. The data can be filtered by loyalty level and card source.
The following metrics are available:
Number of cards issued since the loyalty program started — the total number of active and blocked loyalty cards since the loyalty program was launched.
Number of cards issued during the selected period — the number of loyalty cards activated during the selected period.
Cards issued over the selected period — how the number of loyalty cards issued changes over the selected period.
Card sources for the selected period — the distribution of loyalty cards by how they were issued:
self-registration through the guest account;
manual card issuance by a staff member;
automatic card issuance through the ExelyPMS integration;
manual card issuance in Exely PMS;
file import.
The available card sources depend on how loyalty cards are issued and on the enabled integrations.
Guest activity
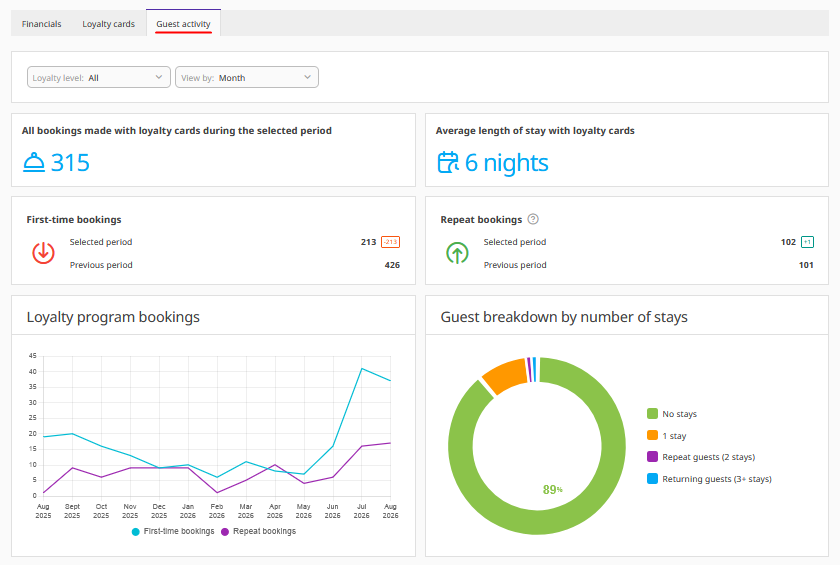
The “Guest activity” tab helps you analyze bookings made by loyalty program members and see how often guests return.
The following metrics are available:
All bookings made with loyalty cards during the selected period — the total number of bookings credited to loyalty cards during the selected period.
Average length of stay with loyalty cards — the average number of nights per booking made with a loyalty card.
First-time bookings — the first bookings made by guests after receiving a loyalty card.
Repeat bookings — the second and all subsequent bookings made by guests with a loyalty card.
There are also the following charts:
The “Loyalty program bookings” chart shows how the number of bookings changed during the selected period.
The “Guest breakdown by number of stays” chart groups loyalty program members into four categories:
No stays — guests who have a loyalty card but did not make any bookings during the selected period
1 stay — guests who made one booking during the selected period
Repeat guests — guests who made two bookings during the selected period
Returning guests — guests who made three or more bookings during the selected period.
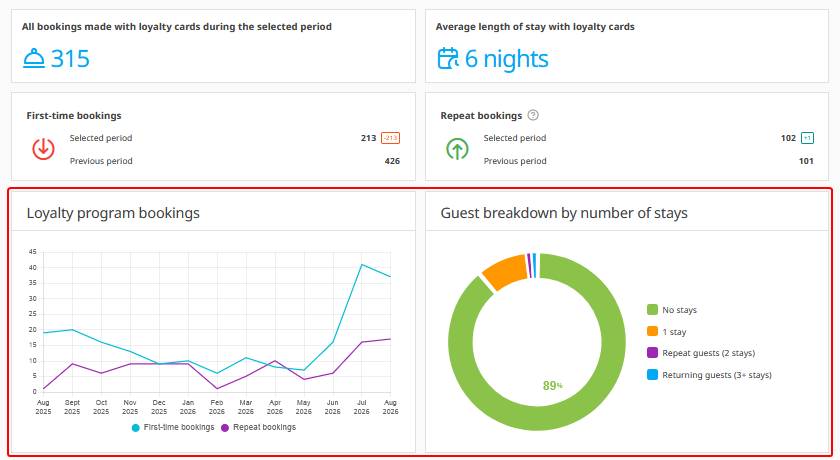
To evaluate the impact of discounts on guest retention, apply the same card level filter and compare the number of first-time and repeat bookings.
Points
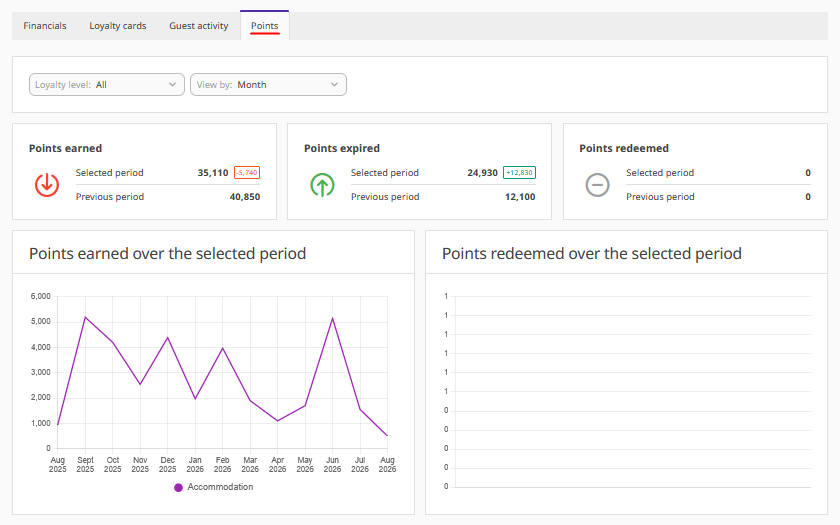
The “Points” tab is available only for points-based loyalty programs. It shows the movement of loyalty points during the selected period.
The following metrics are available:
Points earned — the total number of points earned by guests
Points expired — the total number of points that expired
Points redeemed — the total number of points redeemed for accommodation or services, or deducted manually
There are also the following charts:
The “Points earned over the selected period” chart shows where points were earned:
loyalty program registration;
accommodation;
guest birthdays;
points awarded manually;
bookings from the channel manager;
services from external systems;
The “Points redeemed over the selected period” chart shows how points were redeemed:
accommodation;
services from external systems;
points redeemed manually.
How statistics are calculated
Keep the following rules in mind when analyzing the statistics: time of operations, bookings, and loyalty cards.
Time of operations
Operations are recorded using the property's time zone, not the time zone of the user viewing the statistics. Each day is calculated from 00:00 to 23:59 in the property's local time.
Bookings
Revenue, discounts, bookings, and room nights are included in the statistics five days after the guest checks out. This ensures that bookings cancelled or modified shortly after check-out are not included in the calculations.
Loyalty cards
Only loyalty cards with the “Active” or “Blocked” status are included in the statistics. Deleted cards and cards that have been issued but not yet activated are excluded from the calculations.