After a segment is selected, its page is opened in the “Guest management” > “Guest relations” > “Segments” section.
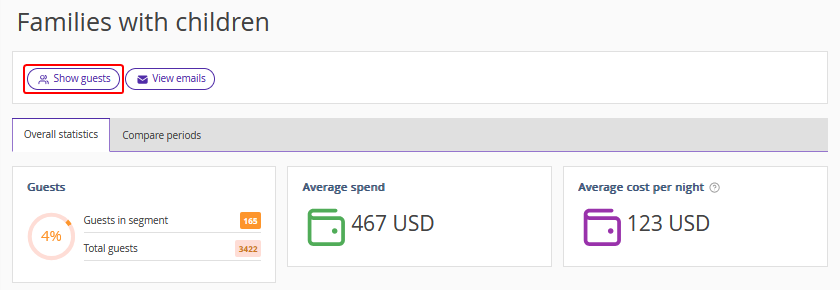
The “Show guests” button
Click the “Show guests” button to see the full list of guests that belong to the segment.
The page in the “Guest management” > “Guest relations” > “Guests” section will be opened. The table displays the list of guests that belong to the segment.
The selected segment is automatically set in the filter.
Pay attention. The current property will be automatically selected in the filter, if it is part of a group.
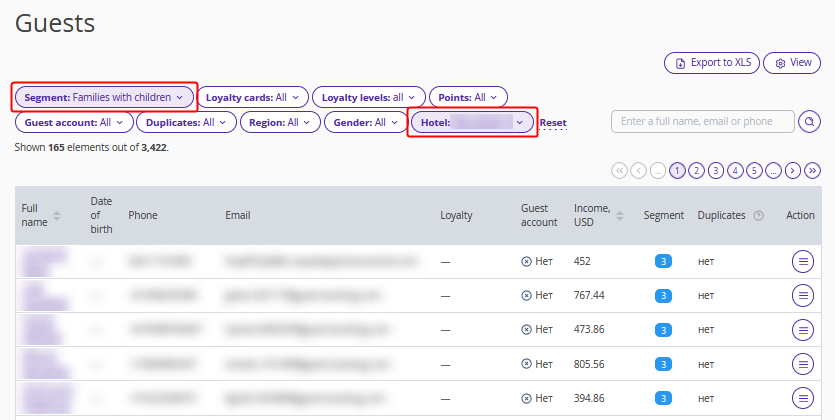
For details on the “Guests” section, refer to the article “How guest list is generated in “Guests” section”.
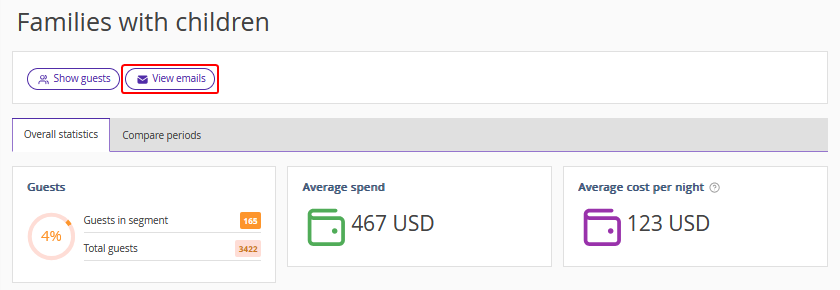
The “View emails” button
Click the “View emails” button to open to the “Emails” page in the “Guest management” > “Guest relations” > “Emails” section.
The “Created emails” table will display a list of automated emails that can be sent to guests from the selected segment. The selected segment will be automatically set in the filter settings.
For more information on the “Emails” section, see the article “What types of automated emails can be set in Exely Guest Relations”.
How to read the segment data
In the Exely extranet, go to “Guest management” > “Guest relations” > “Segments”. To see the detailed information for a segment, click its name in the list. For example, “Families with children”.
The page with the segment data will be opened.
Switch to the required tab:
The “Compare periods” tab allows comparing two selected periods.
The “Overall statistics” tab shows the data for a selected segment for the entire period.
The “Compare periods” tab
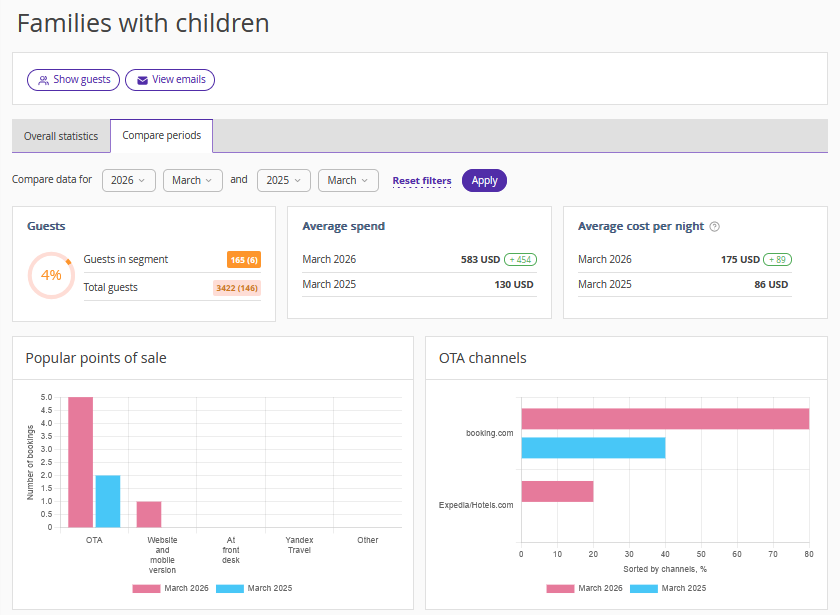
When you go to the segment page, the “Compare periods” tab is opened by default. In the default period settings filters, data for the current month of the year is compared with data for the corresponding month of the last year.
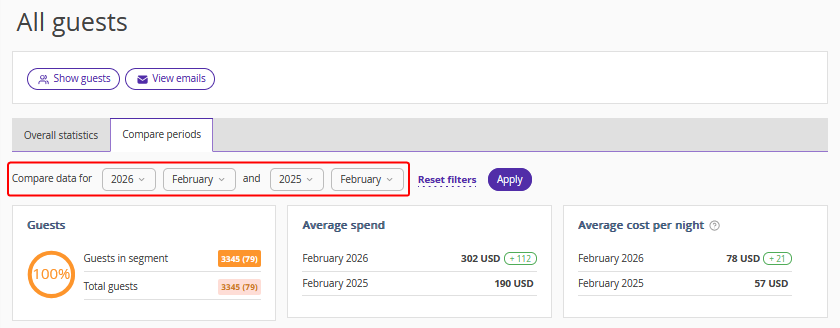
Filter for setting periods for comparison
Use the drop-down lists to select the periods for data comparison.
Click “Reset filters” to reset the filter to default settings.
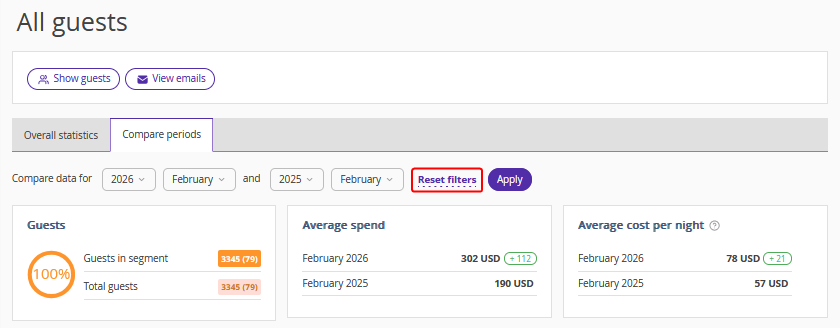
Click the “Apply” button to generate a report for the selected periods.
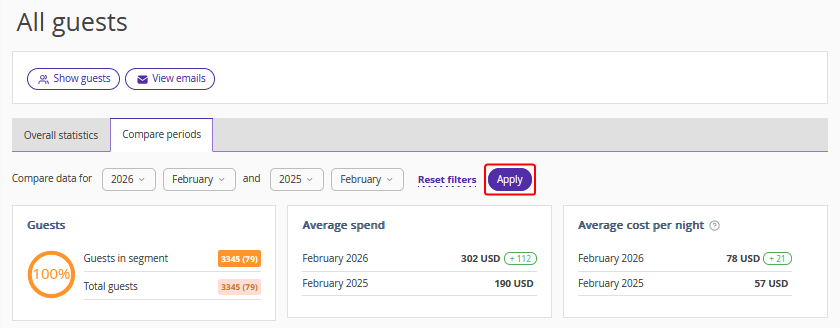
Guests
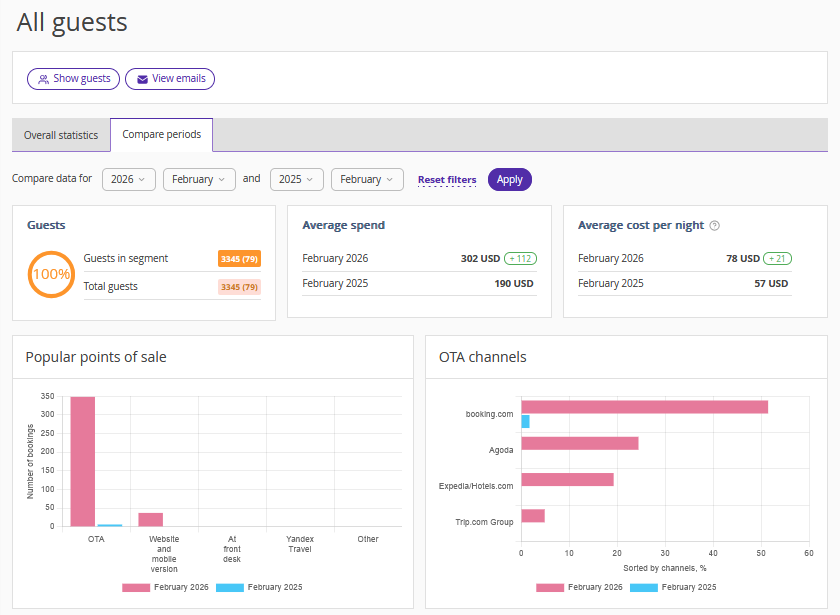
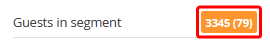
The “Guests” section shows the ratio of the number of guests that belong to the selected segment to the total number of guests.
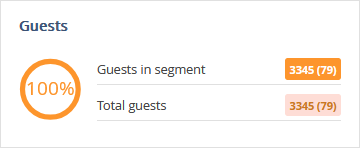
Pay attention. The first number in the report displays the data for the first period selected in the filter. The second number displays data for the second period selected in the filter.
Average spend
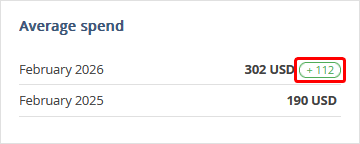
The “Average spend” section displays the average cost of bookings for the selected periods.
Data for the selected period is determined by the booking creation date.
The first number in the report displays the data for the first period selected in the filter. The second number displays the average booking cost for the second period selected in the filter.
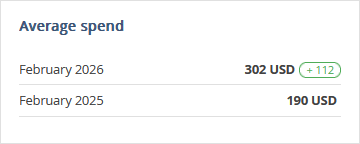
The number in the frame shows the difference between the average booking cost for the selected periods and reflects the increase or decrease in value.
Average cost per night
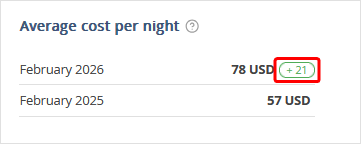
The “Average cost per night” section displays the price per room night for the selected periods. Relevance to the period is determined by the booking creation date.
The first number in the report displays the data for the first period selected in the filter. The second number displays the price per room night for the second period selected in the filter.
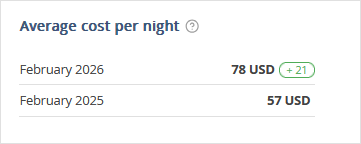
The number in the frame shows the difference between the price per room night for the selected periods and reflects the increase or decrease in value.
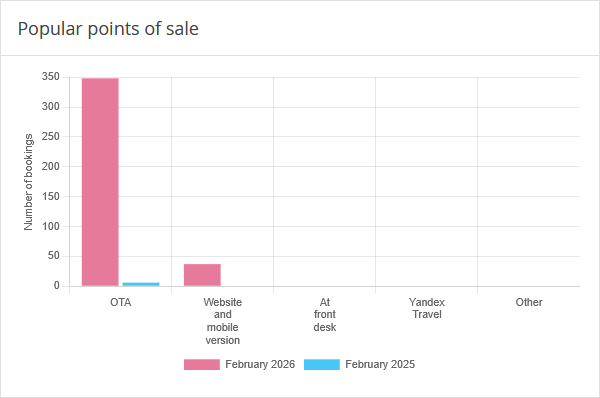
Popular points of sale
The chart displays the number of bookings from channels that were made during the periods selected in the filter.
Data for the selected period is determined by the booking creation date.
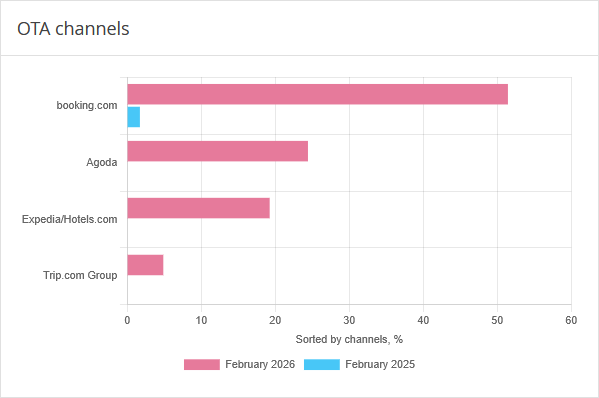
OTA channels
The chart shows data on the distribution of bookings through online travel agencies (OTA) for the periods selected in the filter.
Data for the selected period is determined by the booking creation date.
Bookings
The “Bookings” section displays statistics on active and canceled bookings and arrivals
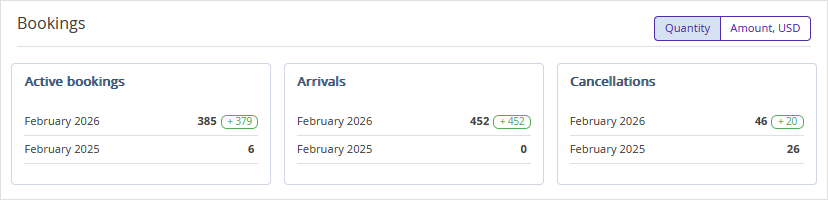
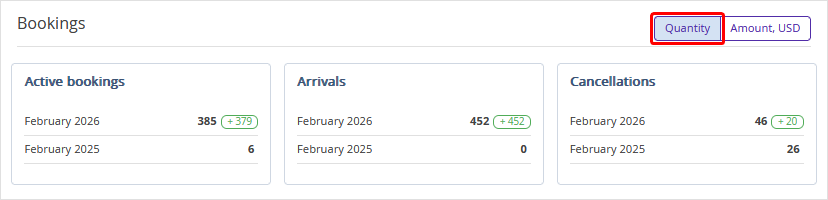
1. Click “Quantity” to have the number of bookings and arrivals displayed in the report.
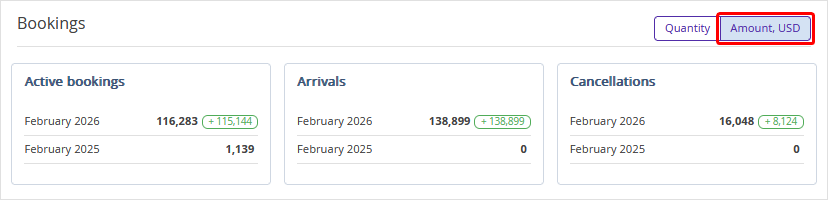
2. Click “Amount” to generate a report on the cost in the property currency.
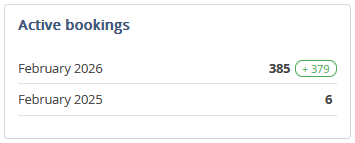
3. Active bookings.
The “Active bookings” section displays the number of guests who made bookings during the first or second period.
Data for the selected period is determined by the booking creation date.
The first number is the number of guests who made bookings during the first period set in the filter and did not cancel them.
The second number is the number of guests who made bookings during the second period set in the filter and did not cancel them.
The number in the frame is the difference between the data for the first and second periods.
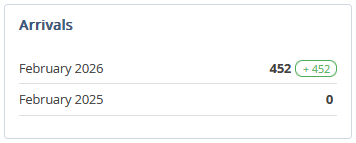
4. Arrivals.
The “Arrivals” section displays the number of guest arrivals for the selected periods and their total cost.
Data for the selected period is determined by the arrival date.
The first number is the number of guests who checked in during the first period set in the filter.
The second number is the number of guests who checked in during the second period set in the filter.
The number in the frame is the difference between the data for the first and second periods.
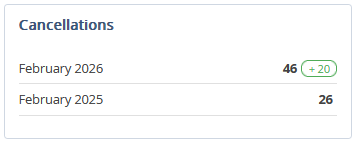
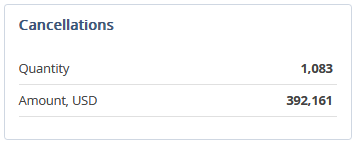
5. Cancellations.
The “Cancellations” section displays the number of guests who canceled their bookings during the first or second period set in the filter.
Data for the selected period is determined by the booking creation date.
The first number is the number of guests who cancelled bookings during the first period set in the filter.
The second number is the number of guests who cancelled bookings during the second period set in the filter.
The number in the frame is the difference between the data for the first and second periods.
Seasonal demand
The chart shows changes in the number of bookings and arrivals by day of the period. This allows you to identify high and low demand dates
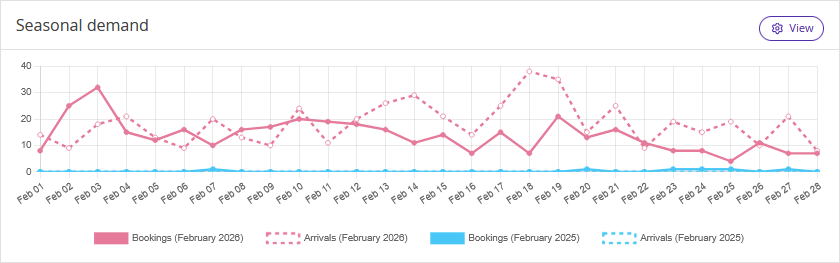
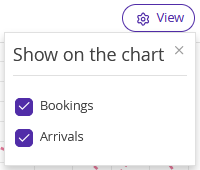
Click the “View” button to set the display of bookings or arrivals charts.

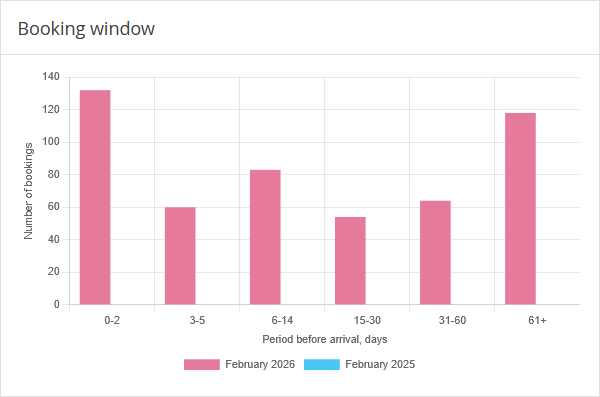
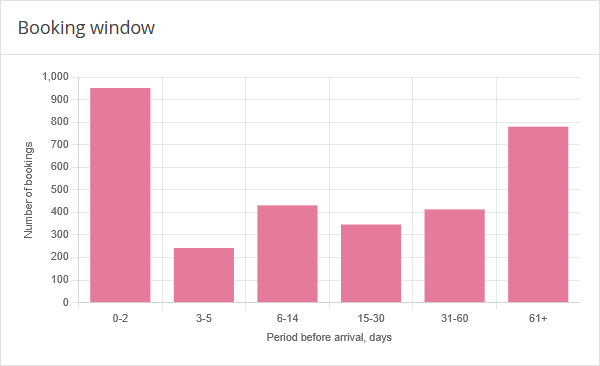
Booking window
The chart contains information on the average time between the booking date and the guest check-in date for the selected periods.
Relevance to the period is determined by the arrival date.
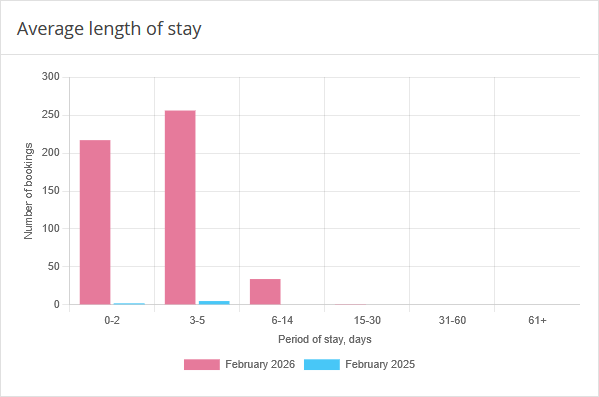
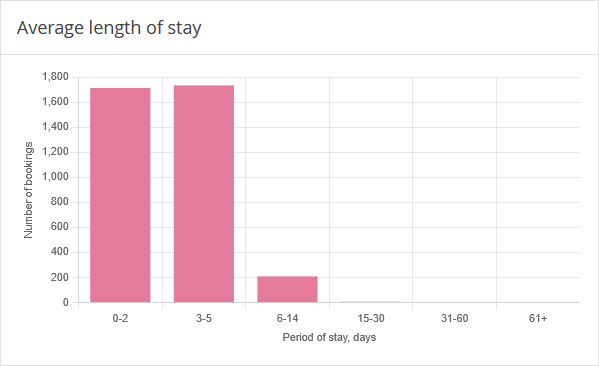
Average length of stay
The chart shows the average length of stay of guests in the property during the selected periods.
Relevance to the period is determined by the booking creation date.
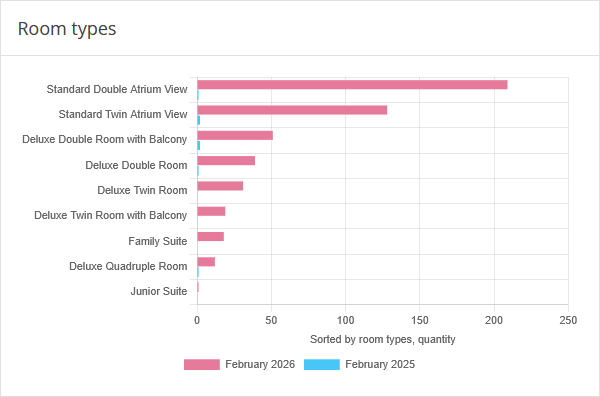
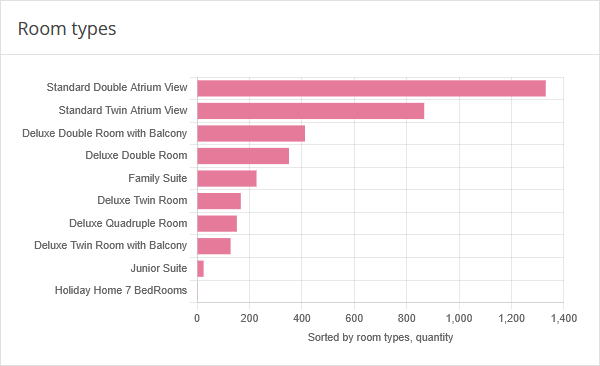
Room types
The chart contains information on the distribution of bookings made during selected periods by different room types.
Relevance to the period is determined by the booking creation date.
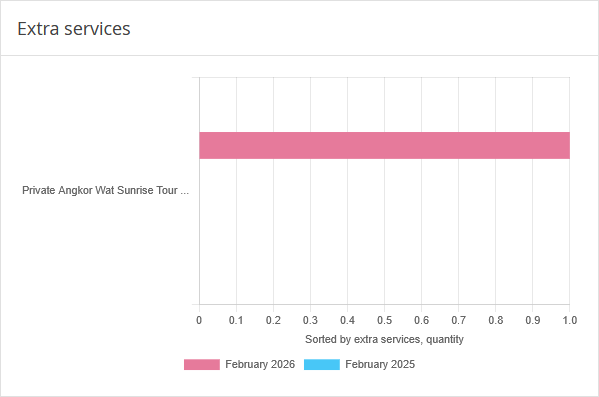
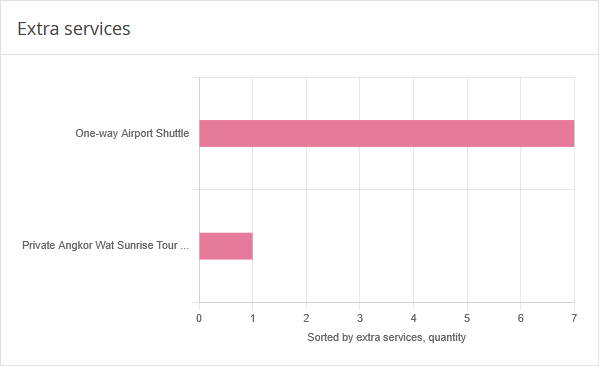
Extra services
The chart shows which services were most frequently used by guests in bookings made during the selected periods.
Relevance to the period is determined by the booking creation date.
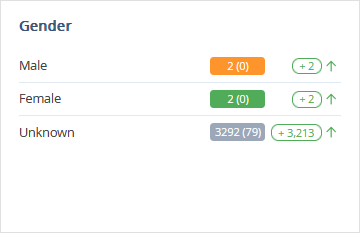
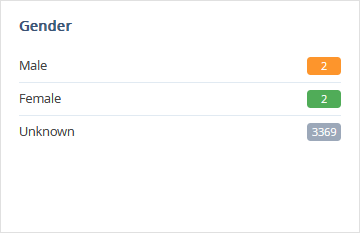
Gender
The “Gender” section contains information on the number of guests of the corresponding gender who were listed in the segment for any number of days from the period specified in the filter.
Relevance to the period is determined by the presence of a guest in the segment.
The first number is the number of guests of the corresponding gender who made bookings during the first period selected in the filter.
The number in brackets is the number of guests of the corresponding gender who made bookings during the second period selected in the filter.
The number in the frame is the difference between the data for the first and second periods.
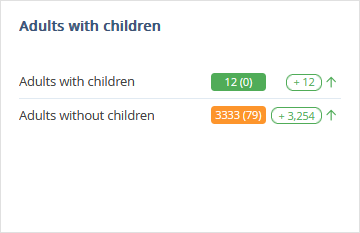
Adults with children
The “Adults with children” section shows the number of guests with children who made bookings during the first or second period set in the filter.
Relevance to the period is determined by the booking creation date.
The first number is the number of guests with children who made bookings during the first period selected in the filter.
The number in brackets is the number of guests with children who made bookings during the second period selected in the filter.
The number in the frame is the difference between the data for the first and second periods.
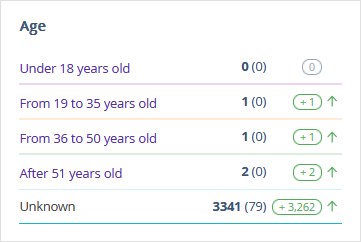
Age
The “Age” section contains information on the number of guests of a certain age who were listed in the segment for any number of days from the period specified in the filter.
Relevance to the period is determined by the presence of a guest in the segment.
The first number is the number of guests of the corresponding age range who made bookings during the first period selected in the filter.
The number in brackets is the number of guests of the corresponding age range who made bookings during the second period selected in the filter.
The number in the frame is the difference between the data for the first and second periods.
Regions
The “Regions” section shows the number of guests who arrived from different regions and were listed in the segment for any number of days from the period set in the filter.
Relevance to the period is determined by the presence of a guest in the segment.
Pay attention. In this section, the data about the guest's region of residence specified in Exely PMS or other PMS integrated with Exely is used.
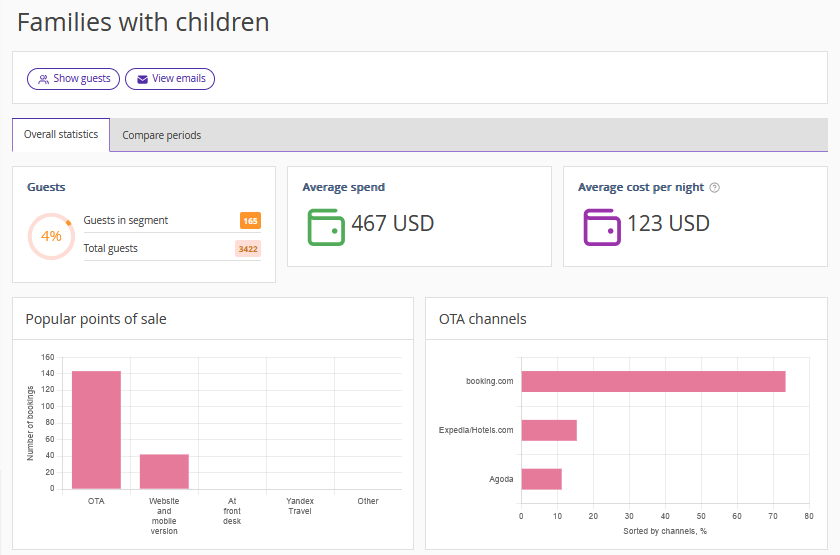
The “Overall statistics” tab
The “Overall statistics” tab, displays data for the entire period of data collection. For details, refer to the article “How to find out for which period guest data is collected in Exely Guest Relations”.
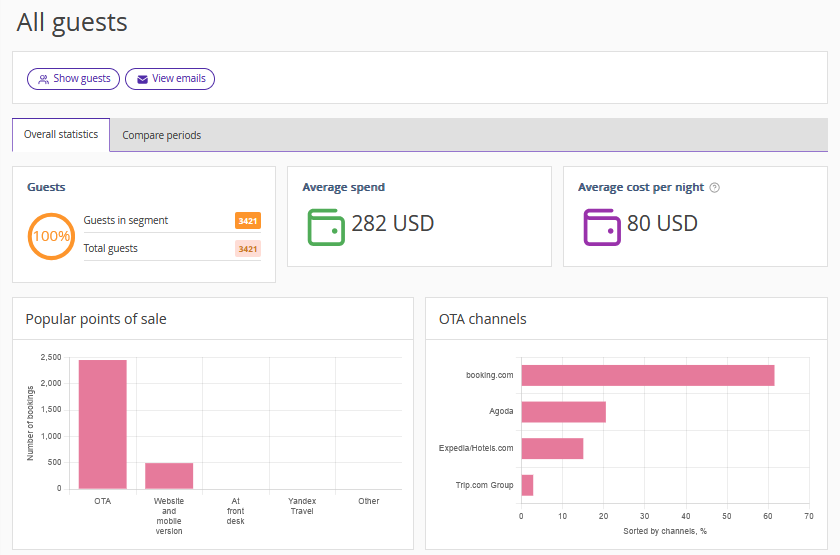
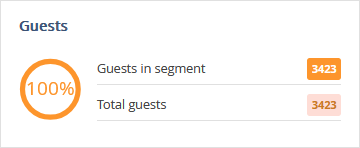
Guests
The “Guests” section shows the ratio of the number of guests in the segment to the total number of guests.
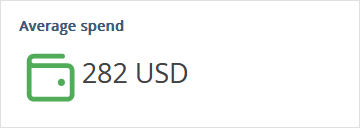
Average spend
The “Average spend” section shows the average booking cost. The calculation includes data for the entire period.
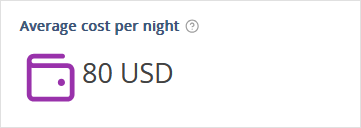
Average cost per night
The “Average cost per night” section shows the average price per room night for the entire period.
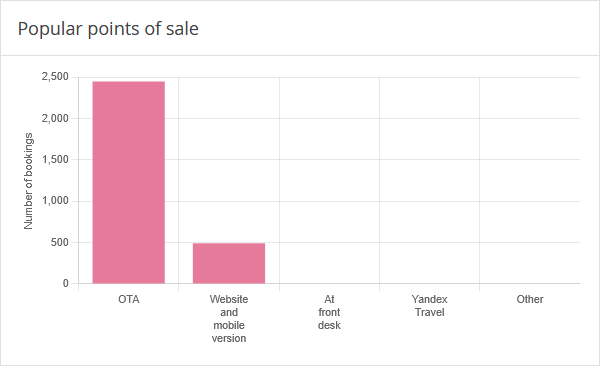
Popular points of sale
The chart displays the channels through which a property receives the most bookings.
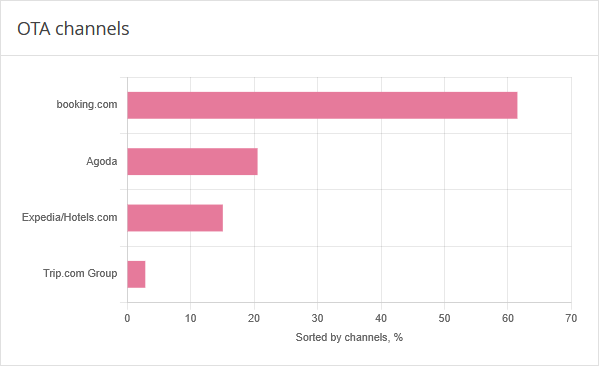
OTA channels
The chart shows data on the distribution of bookings received through online travel agencies for the entire period.
Bookings
The “Bookings” section displays statistics on active and canceled bookings and arrivals for the entire period.
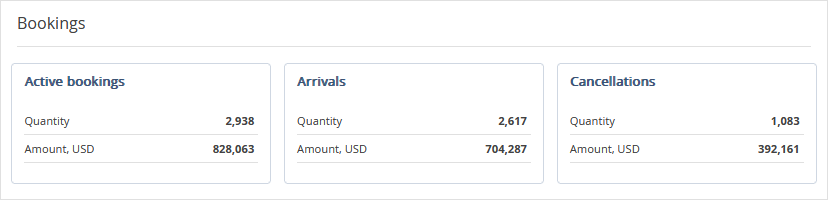
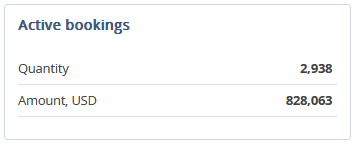
1. Active bookings.
The section contains information about the total number of uncanceled bookings and bookings that have not yet been finalized, and their total value.
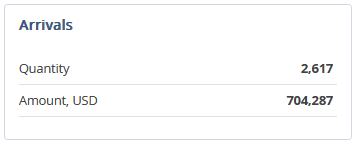
2. Arrivals.
The section shows the total number of guest arrivals for the entire period.
3. Cancellations
The section displays the number of canceled bookings for the entire period and their total cost.
Seasonal demand
The graph shows the changes in the number of bookings and arrivals for the entire period.
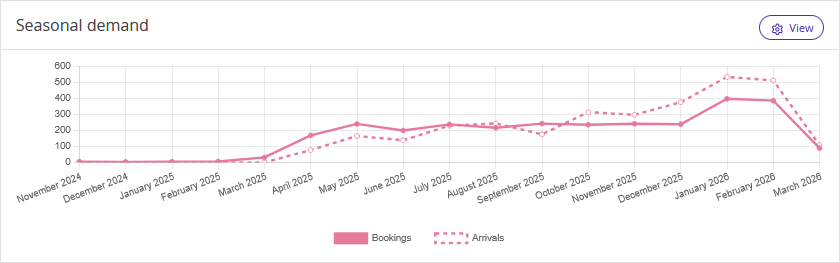
Click the “View” button to set the display of bookings or arrivals charts.
Booking window
The chart provides information on the average time between the booking date and the guest check-in date.
Average length of stay
The chart shows the average length of stay of guests in the property.
Room types
The chart contains information on the distribution of bookings by different room types.
Extra services
The chart shows which services were used most often by guests over the entire period.
Gender
The “Gender” section contains information about the distribution of guests by gender.
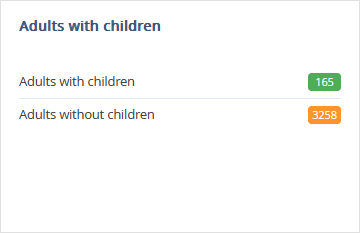
Adults with children
The “Adults with children” section shows statistics on bookings with children.
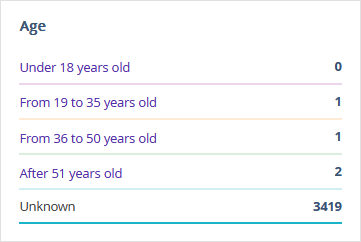
Age
The “Age” section contains information about the distribution of guests by age ranges.
Regions
The “Regions” section shows data on the number of guests arriving from different regions.
Pay attention. In this section, the data about the guest's region of residence specified in Exely PMS or other PMS integrated with Exely is used.