Pay attention. Since October 2025, the updated version of the Analytics section is available in the Exely extranet, replacing the previous version described in this article. Use the updated Exely Analytics for a more convenient analysis of your performance indicators. If necessary, you can refer to the previous version to view data for past periods.
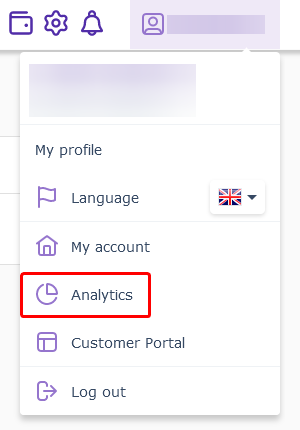
To open Exely Analytics, click your login in the upper right-hand corner and select “Analytics” in the list:

The “Reservations analysis” contains the following pages:
Reservation dynamics — this report shows the changes in the number of reservations and cancellations made on your hotel website. It includes data on your hotel sales day by day for the last month. It displays details on the number of bookings, cancellations, the average length of stay, and the average daily rate.
Payment method — you will see the breakdown of bookings based on payment options selected by guests. This report will help you understand what payment methods are the most popular among your guests.
Room types — the report displays the percentage of bookings that fall in each room category. It shows you what room types are the most and the least popular at your property.
Additional services — the report shows the frequency of extra service purchases and how popular each service is among guests.
Special offers and rates — the report displays the percentages of website bookings made at each of your rate plans. There, you can also find how much revenue you got from each of the rate plan sales.
Check-ins and check-outs dynamics — the report displays what days of the week check-ins and check-outs fall.
Sales of rooms — in the report, there is the number of rooms that are going to be occupied.
The “Site conversion” menu section displays the ratio of users visiting your website to users who actually make bookings. The graph shows how this ratio grows and drops as time goes by. This menu section contains data on the number of bookings and website traffic day by day for the last month.
In the “Visitors” menu section, there are four pages:
Website traffic — the report shows how the number of website visitors and unique website visitors changes. This data is broken down by days, weeks, and months.
Popular pages — the report displays how many website pages are viewed by users every day, week, or month. Below, there is a list of the most popular pages on the website.
Visitors’ cities — there is a list of locations where your website users come from. This data can come in handy when you plan a promotional campaign. Besides that, on the website, you can provide some information specifically for guests from this or that city.
Mobile devices — there is a ratio of desktop and mobile traffic. There is also a list of the most popular smartphone models used to go to your website.
In the “Sources” menu section, you can study the following reports:
All sources — the graph shows the ratio of all the traffic sources: direct visits, transitions from websites, transitions from search systems, social networks, and others.
Direct visits — there is the number of direct visits of your website. Traffic is considered direct if users enter your website address in the search bar. The number of direct visits is broken down by days, weeks, and months.
Transitions from sites — there is the number of times users were redirected to your website from other platforms. Below, there is a list of websites from which users reached your brand website.
Search systems — there is data on times when users reach your website from search engines. There is a list of search engines and search queries used by users.