The “Sales distribution” report in Exely Advisor shows the sales distribution in your property by points of sale, room types, and rate plans. Track metrics and adjust your sales strategy.
How to generate the report
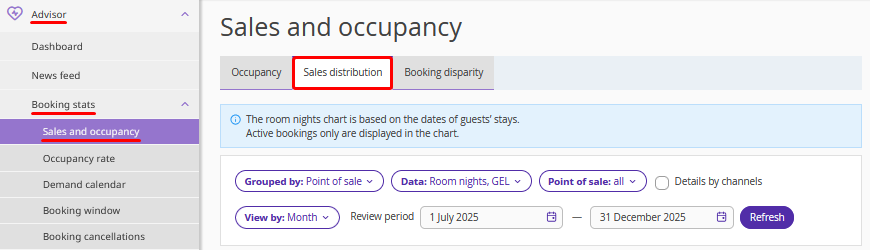
1. In the Exely extranet, go to “Advisor” > “Booking stats” > “Sales and occupancy” > the “Sales distribution” tab.
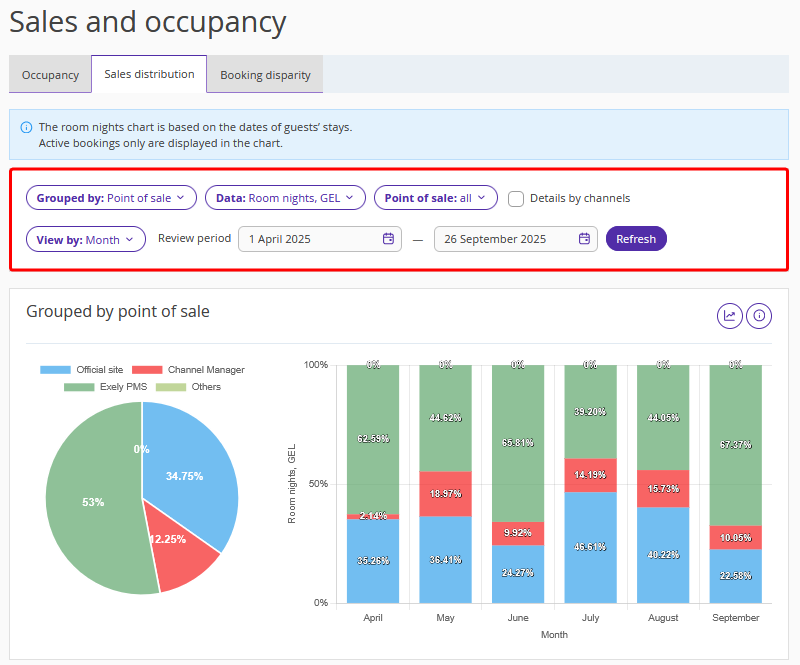
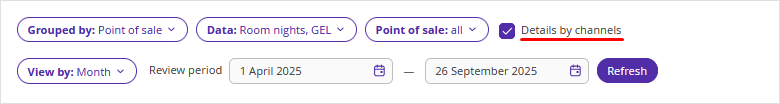
2. Set the review period, use the filters to select data sources, and click “Refresh”. A chart will be generated.
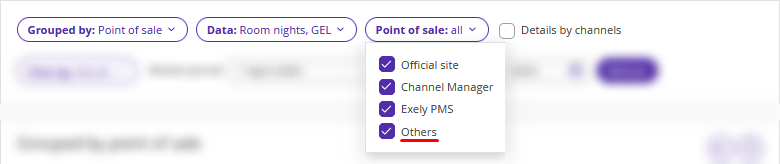
Pay attention. In the “Point of sale” filter, the “Others” option includes imported bookings and bookings made from the Exely extranet.
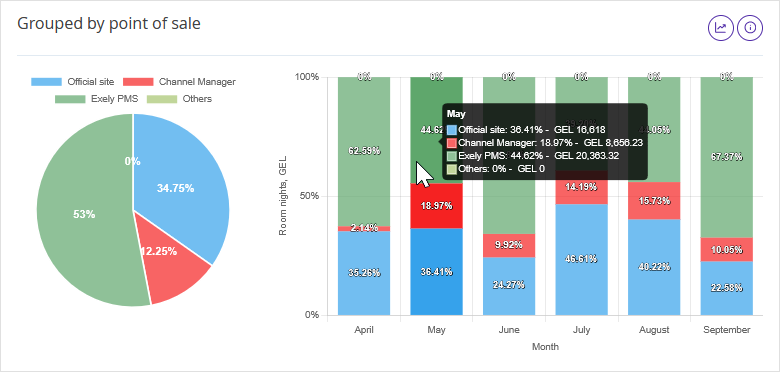
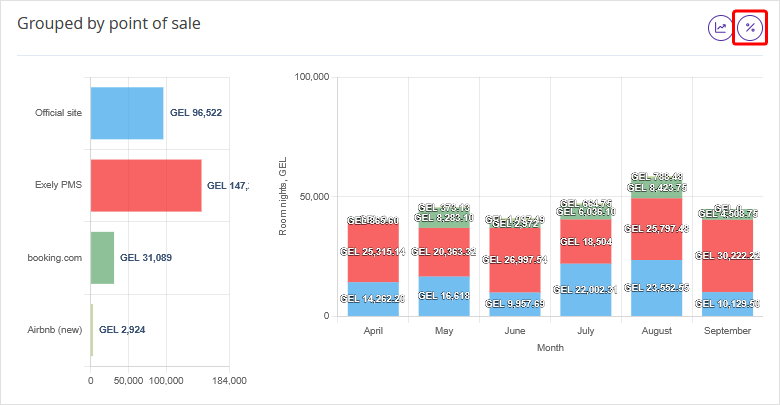
To see additional chart values, hover the cursor over a graph.
If you do a search with the “Details by channels” check-box ticked, the “Channel Manager” source will be displayed in the expanded view with a breakdown by OTA.
If you click the button on the right, the display will change — the report will show the income for each OTA for the selected period.
How to use the report
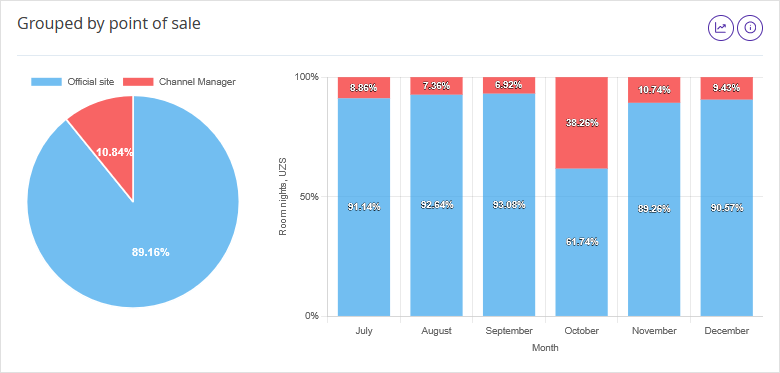
For example, you see that the number of bookings for October 2025 through the official website has decreased and the number of bookings made via the channel manager has increased compared to the previous months.
To increase the number of bookings from the official website, change your sales tactics, for example:
Set equal pricing across all OTAs. This will allow you to prevent giving certain agents a competitive advantage and discourage guests from looking for better deals.
Create separate rate plans and favorable offers for the site.
Pay attention to marketing — promote your website using SEO, contextual advertising, targeting, and social media.