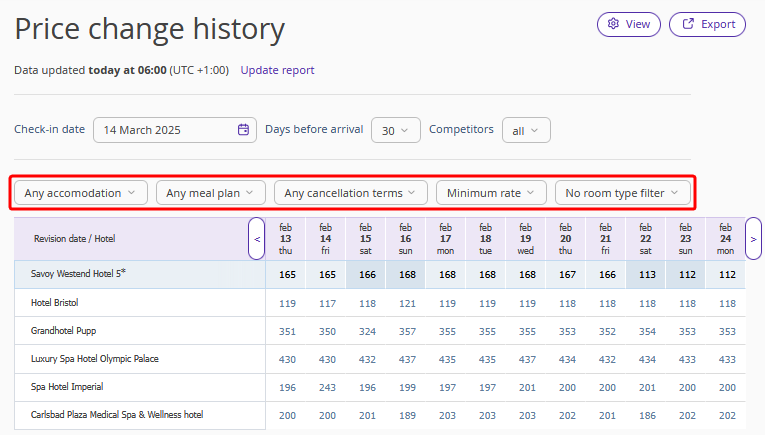
Competitors average rate
Competitors average rate is calculated from the sum of the competitors' prices for the day divided by the number of competitors. If a competitor has closed sales for the day, it is not included in the number of competitors when dividing.
In the “Price monitor” > “Competitors average rate” section, you can use a table or graph to compare the average price to the price of your property or a competitor.
The table shows the same information as in the “Price monitor” > “Competitors prices” section, but in a more simplified form: a line with data for your property or the required competitor, a line with the average price and an index. Index is the ratio of your average rate to that of your competitors.
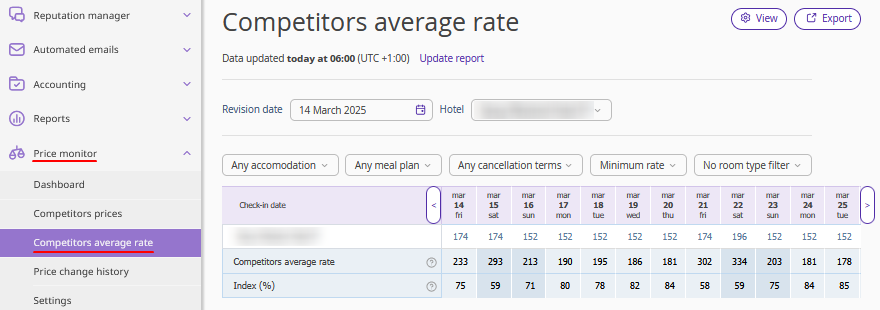
The information from the table is presented in the form of a chart. The chart contains the following labels:
Your property or competitor.
Competitors average rate.
Price range is a chart showing the competitors' prices from 0 to the maximum value according to the selected filters (minimum, maximum, average rate, etc.). The colored area helps you to see the difference between the average rate graph and the competitors' maximum values.
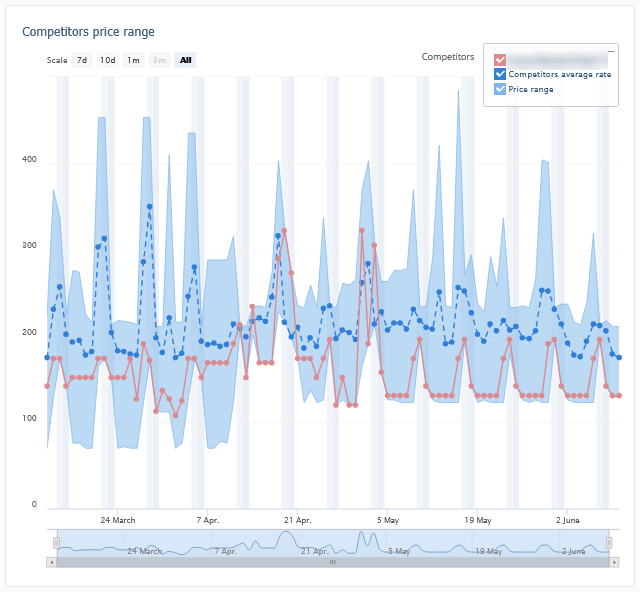
If you use filters, the information in the table and graph will change.
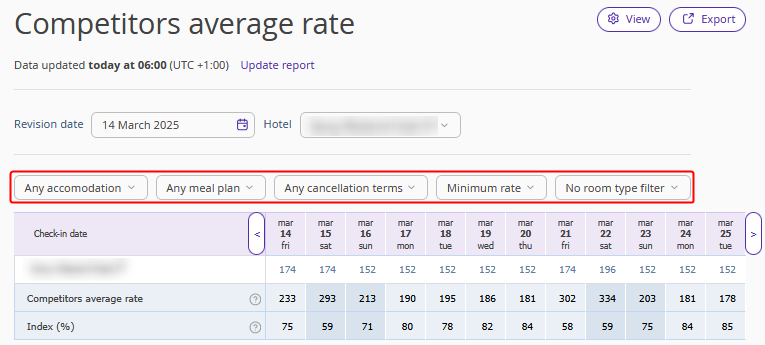
Price change history
In the “Price monitor” > “Price change history” section, you can view competitors' prices for the past period.
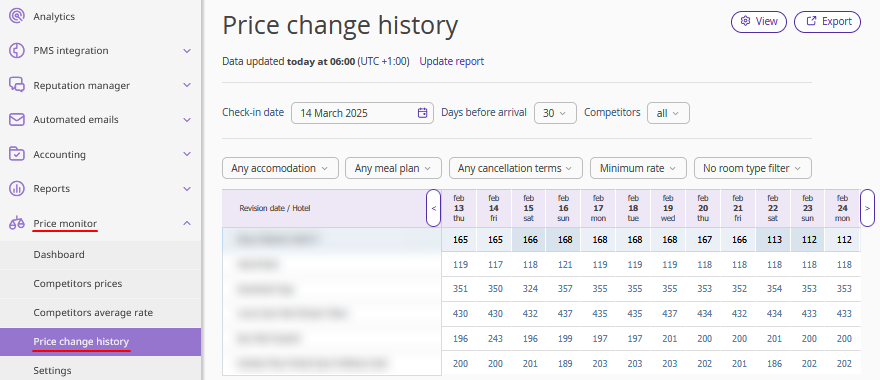
The information in the table is the same as in the “Price monitor” > "Competitors prices" subsection, but has a different display area: the table in "Competitors prices" shows prices for today and future dates, and in ‘Price change history’ — the prices for today and past dates.
If you have added a new competitor, the prices will appear starting from the date the new competitor was added. The dates where the competitor was not added will have dashes.

The information from the table is presented in the form of a chart.
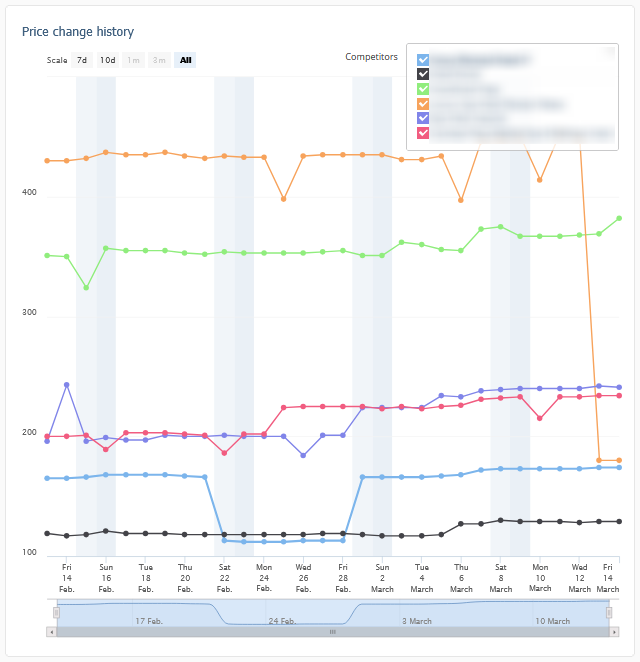
If you use filters, the information in the table and graph will change.
